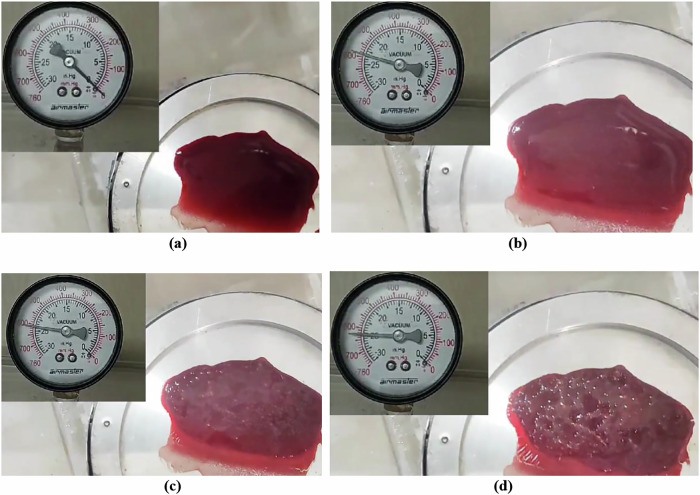
Fig. 2. Subject-specific differences in microbubble formation under vacuum-induced decompression.
a–d Progressive stages of visually detectable bubble nucleation and phase transitions in venous blood during vacuum-induced decompression at 40 °C, showing: a fresh blood sample before devacuumization, b initial observable bubbling at 590 mmHg, c increased bubble intensity at 610 mmHg, and d advanced aggregation and structural transitions at 625 mmHg.

