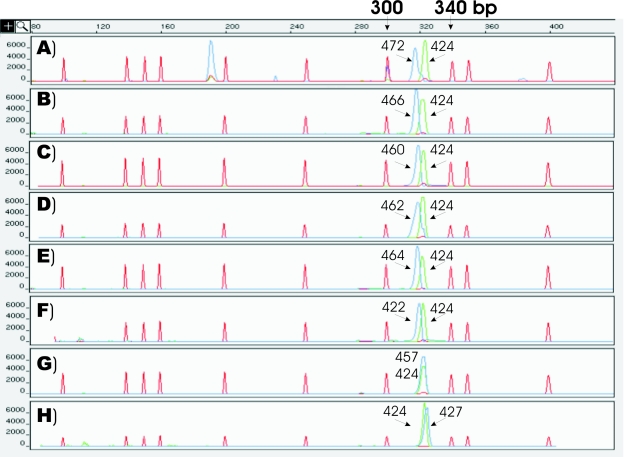
FIG. 2.
B. anthracis genotype 3 polymorphisms. This figure reports a combined screen capture image of capillary fluorescent electrophoresis of the pXO2-A test. Colors of samples (blue), Carbosap (green), and ROX500 (red) correspond to different fluorescent labels. The Carbosap-hex and Carbosap-fam runs are not reported here because peaks perfectly overlapped, similarly to those shown in panel G. All of the graphs were compared after normalization of the profiles with the genotype program according to the internal standard. The heights of the peaks were adjusted to the same range of absorbance, as shown on the left side of each picture. The keys shown in the figure are those reported in Table 3, i.e., sample 424 Carbosap, sample 472, B. anthracis strain 10 and so on. On the top of the figure, the 300- and 340-bp marker sizes of ROX500 are shown. From panels A to H the computed peak shift “sample/Carbosap” values were −5, −4, −3, −2, −1, 0, and +1 bp, respectively.

