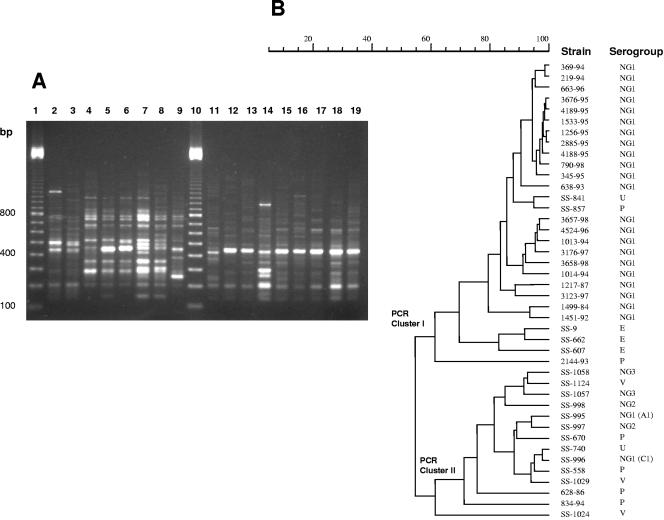
FIG. 2.
(A) RAPD-PCR profiles of representative S. porcinus isolates. Lanes 1 and 10, molecular size markers (100-bp ladder); lane 2, SS-9; lane 3, SS-662; lane 4, SS-670; lane 5, SS-841; lane 6, SS-857; lane 7, SS-997; lane 8, SS-998; lane 9, SS-1024, lane 11, 1217-87, lane 12, 1451-92; lane 13, 638-93; lane 14, 834-94; lane 15, 1013-94; lane 16, 345-95; lane 17, 4188-95; lane 18, 3176-97; and lane 19, 790-98. (B) Dendrogram resulting from computer-assisted analysis of the RAPD-PCR profiles of S. porcinus isolates. The Pearson product moment correlation coefficient was used for calculating the percentage of similarities among the profiles.

