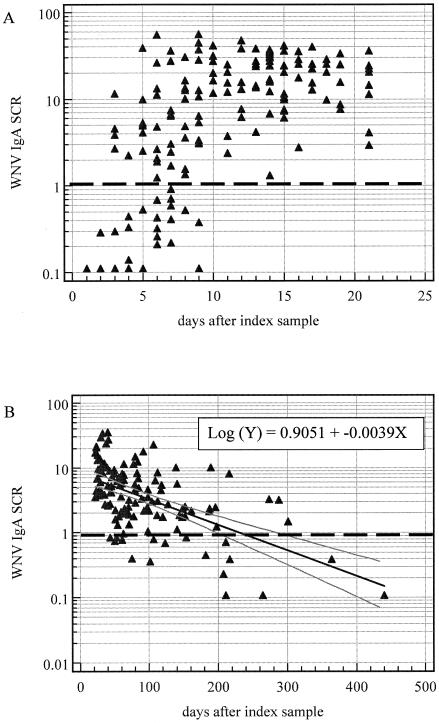
FIG. 2.
WNV IgA SCR values for follow-up samples from viremic blood donors whose index donations were negative for WNV antibodies. The dark dashed horizontal line in each panel indicates an SCR of 1.00, used to discriminate positive from negative results. (A) Samples collected on days 1 to 21 of follow-up. (B) Samples collected on days 22 to 440 of follow-up. The dark solid line represents the linear regression trend line, and the two lighter parallel lines represent the 95% confidence interval; the line formula is shown in the upper right-hand corner.

