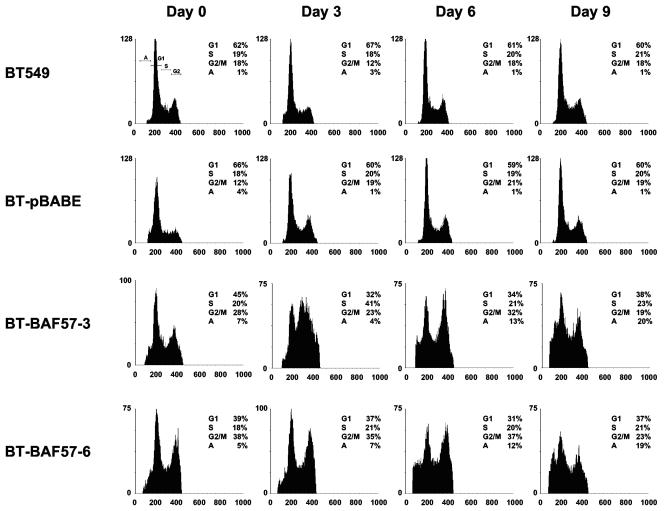
FIG. 3.
FACS analysis of wild-type and BAF57-expressing BT549 cell lines. An equal number (5 × 10⁴) of BT549, BT-pBABE, BT-BAF57 clone 3, or BT-BAF57 clone 6 cells was seeded into 15-cm plates and allowed to grow for the indicated times. Next, cells were fixed, stained with propidium iodide, and analyzed on a FACSCalibur flow cytometer. The cell cycle profile of each cell line was determined at least three times, and representative histograms are shown.

