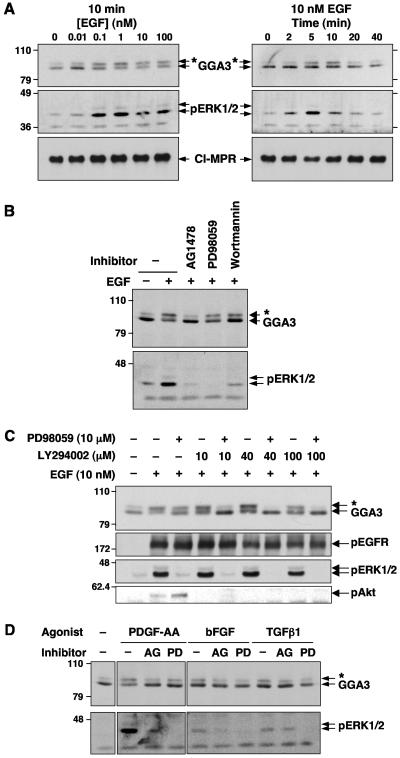
FIG. 2.
Characterization of growth factor-dependent phosphorylation of GGA3. (A) Concentration dependence and time course of EGF-induced GGA3 phosphorylation. Serum-starved M1 cells were stimulated for 10 min with the indicated concentrations of EGF (left panels) or for the indicated times with 10 nM EGF (right panels). (B) Serum-starved M1 cells were treated with 1 μM AG1478, 10 μM PD98059, or 100 nM wortmannin for 30 min prior to stimulation with 10 nM EGF. (C) Serum-starved M1 cells were treated with 10 μM PD98059 and/or the indicated concentrations of LY294002 for 30 min prior to stimulation with 10 nM EGF. (D) Serum-starved M1 cells were incubated in the presence of 0.5% dimethyl sulfoxide (− inhibitor), 1 μM AG1478 (AG), or 10 μM PD98059 (PD) for 30 min prior to stimulation with 10 ng/ml (0.35 nM) PDGF-AA, 10 ng/ml (0.58 nM) basic fibroblast growth factor (bFGF), or 1 ng/ml (0.04 nM) transforming growth factor β1 (TGFβ1) for 10 min. In all panels, GGA3, phosphorylated ERK1/2 (pERK1/2), cation-independent mannose-6-phosphate receptor (CI-MPR), phosphorylated EGF receptor (pEGFR), and phosphorylated Akt (pAkt) were analyzed by SDS-PAGE and immunoblotting, as indicated. Numbers on the left indicate the positions of molecular mass markers (in kilodaltons), and asterisks indicate the position of phosphorylated GGA3.

