FIG. 9.
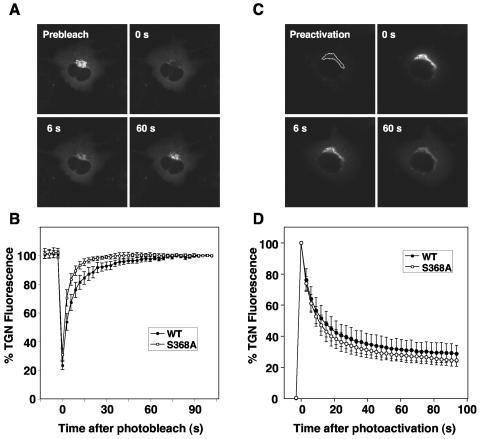
Dynamics of GGA3 binding to membranes in live cells analyzed by photobleaching and photoactivation. (A) The kinetics of association of GFP-GGA3 with the TGN in stably transfected M1 cells were studied by fluorescence recovery after photobleaching. The dashed line indicates the area that was photobleached with high laser intensity at time zero. Fluorescence recovery was assessed at different times after photobleaching. (B) Quantification of the FRAP data for wild-type GFP-GGA3 and the S368A mutant from a set of eight experiments similar to that described for panel A. Values are the mean ± standard deviation. (C) The kinetics of dissociation of photoactivatable GFP (PAGFP)-GGA3 from the TGN in stably transfected M1 cells were studied after photoactivation of the area delimited by the dashed line. (D) Quantification of the dissociation data for wild-type PAGFP-GGA3 and the S368A mutant from a set of six experiments similar to that described for panel C. Values are the mean ± standard deviation.

