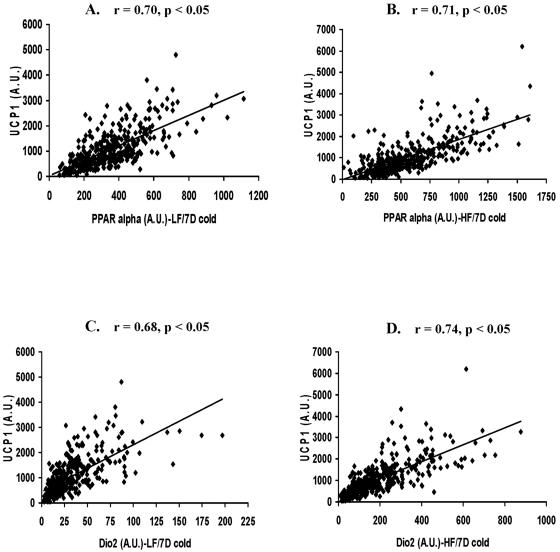
FIG. 3.
Correlation analysis between Ucp1 and Pparα mRNA levels in backcross progeny exposed to cold at 5°C and fed either an LF diet (A) or an HF diet (B). A correlation analysis was also made between Ucp1 and Dio2 mRNA levels in backcross mice fed an LF diet (C) or an HF diet (D). There were 387 and 386 mice in the LF and HF groups, respectively. D, days; A.U., arbitrary units.

