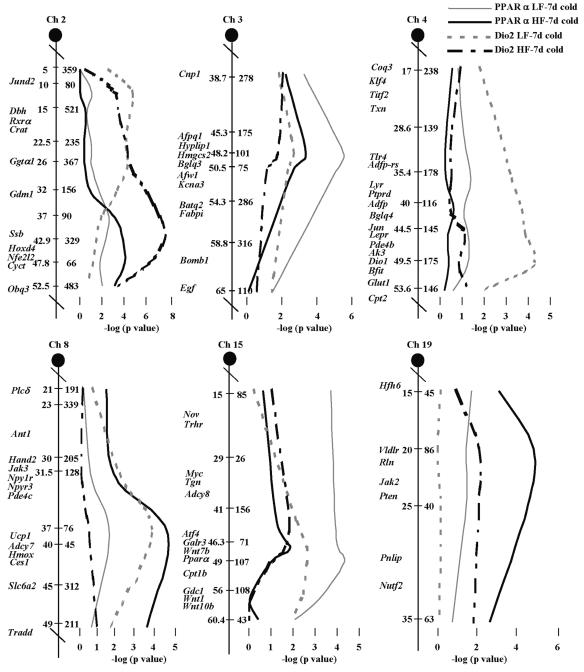
FIG. 4.
Interval maps of QTLs controlling Pparα and Dio2 mRNA levels in mice fed an LF or an HF diet based upon recombinations between microsatellite markers using 387 and 386 mice fed an LF or an HF diet. Microsatellite markers are shown on the right side of each Chr, and centimorgan (cM) distances and candidate genes are shown on the left side. The statistical significance of the association between mRNA levels and chromosomal markers is given as the negative log of the P value. The P values for peak markers are given in Table 3. Linkage maps were generated by analysis of variance of microsatellite markers with gene expression levels and positioned on the Chr with the use of the Jackson Laboratory genome database. d, days.

