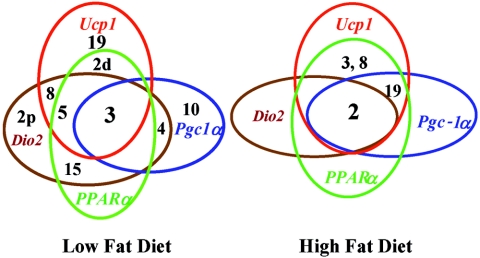
FIG. 5.
Venn diagrams for Chr and gene expression illustrating the overlapping function of selective Chr in regulating genes associated with the regulatory network controlling Ucp1 function. The diagrams also underscore the profound effects of diet on genes associated with regulatory networks of Ucp1 expression. Numbers refer to Chr carrying QTLs, and those within an oval are those QTLs associated with regulation of the indicated gene.

