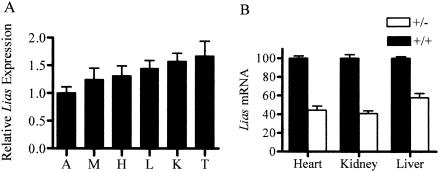
FIG. 4.
(A). Expression of the Lias gene. (A) The mRNA expression levels of the Lias gene in aorta (A), skeletal muscle (M), heart (H), liver (L), kidney (K), and testis (t) in eight wild-type C57BL/6J mice. Lias mRNA levels relative to β-actin mRNA in each tissue were determined by the real-time quantitative PCR as described in Materials and Methods. Expression levels in tissues are presented relative to the level in the aorta, which was set at 1.0. Data are shown as means ± standard errors of the means (error bars). (B) Lias mRNA expression in the heterozygotes. The amounts of Lias+/− mRNA in the heart, kidney, and liver are expressed relative to those in Lias+/+ mice. Values are the means ± standard errors of the means (error bars) of nine animals in each group of Lias+/+ or Lias−/− mice.

