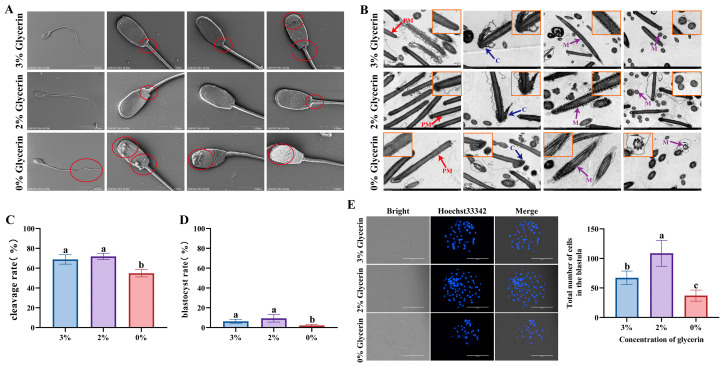
Figure 6.
Effects of different concentrations of glycerol (0%, 2%, and 3%) on the freezing diluent on post-thaw boar sperm ultrastructure and fertilization ability. (A) SEM image of post-thawed boar sperm. Red circled areas in the images correspond to sites of structural defects in sperm. (B) TEM image of post-thawed boar sperm. PM, plasma membrane; C, acrosomal cap; M, mitochondrial sheath. Orange-boxed regions in the images indicate localized enlargements for detailed observation. (C) Cleavage rate after IVF with post-thawed boar sperm. (D) Blastocyst rate after IVF with post-thawed boar sperm. (E) Total number of cells per blastocyst after IVF with post-thawed boar sperm, scale bar: 200 μm. Different lowercase letters indicate statistical differences at p < 0.05.

