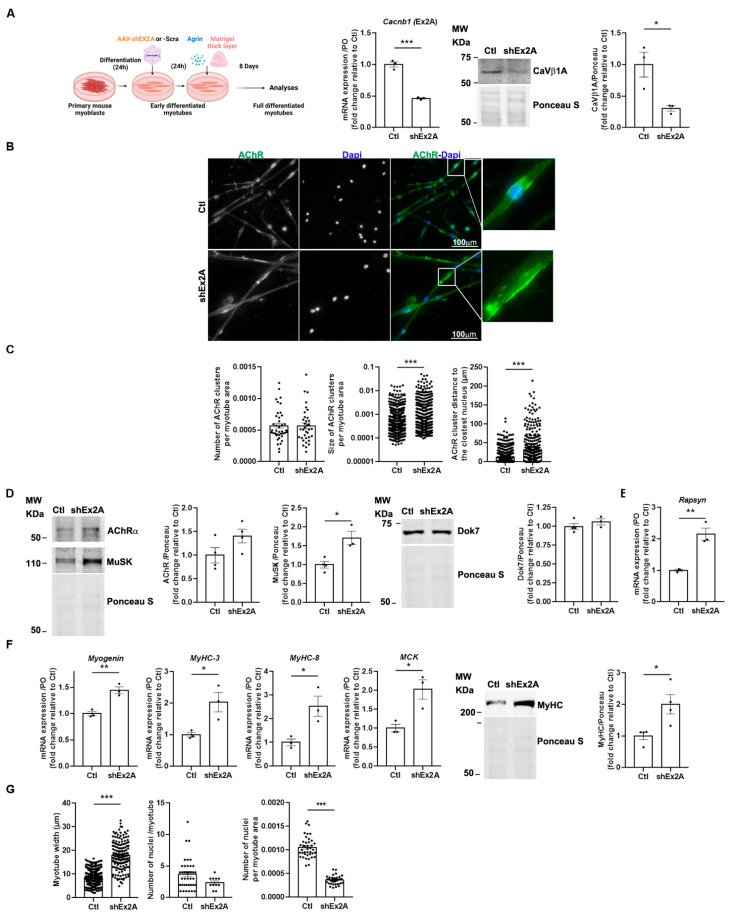
Figure 3.
Downregulation of embryonic CaVβ1 isoforms induces bigger AChR aggregates and myotube precocious maturation in an in vitro model of highly differentiated myotubes. (A) Schematic representation of the experimental protocol. RT-qPCR of Cacnb1 exon2A (Ex2A), Western Blot, and quantification of CaVβ1A in the control (Ctl) and shEx2-treated myotubes. (B) Immunofluorescence (IF) images of the control or shEx2A-treated myotubes stained with AChRa1 (green) and DAPI (blue). (C) Quantification of AChR cluster number and size per myotube area and distance between AChR clusters and the nearest nuclei. (D) Western Blot and quantification of AChR, MuSK, and Dok7 in the control and shEx2A-treated myotubes. (E) RT-qPCR of Rapsyn in the control and shEx2A-treated myotubes. (F) RT-qPCR of Myogenin, MyHC-3, MyHC-8, and MCK in the control and shEx2A-treated myotubes and Western Blot and quantification of MyHC in the control and shEx2A-treated myotubes. (G) Quantification of the number of nuclei per myotube and number of nuclei per myotube in the control and shEx2A-treated myotubes. All data are mean ± SEM (* p < 0.05, ** p < 0.01, and *** p < 0.001). p values were calculated by an unpaired t-test (A–G).

