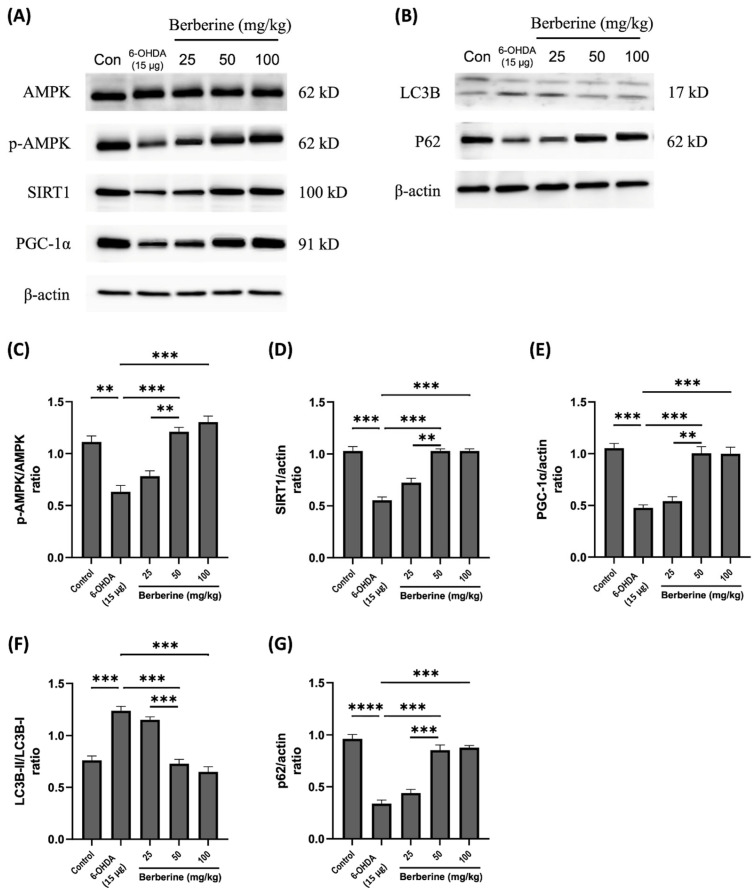
Figure 5.
Effects of berberine on 6-OHDA inhibited AMPK-mediated mitochondrial dynamics and autophagic flux balance in animal model. (A) Levels of AMPK phosphorylation and expression of SIRT1 and PGC-1α proteins. (B) Expression levels of LC3B and p62 proteins. (C) p-AMPK/AMPK quantitative graph. (D) SIRT1/actin quantitative graph. (E) PGC-1α/actin quantitative graph. (F) LC3B-II/LC3B-I quantitative graph. (G) p62/actin quantitative graph. C57BL/6 mice were administered with berberine orally at different doses (25, 50, 100 mg/kg) for four weeks. Subsequently, mice were injected with 6-OHDA at a dose of 15 μg, and berberine was administered orally. Proteins were isolated from the right striatum tissue, which was the site of 6-OHDA injection. The intensity of the band was calculated using ImageJ software (version 1.53a). β-actin was used as an internal control. Similar results were obtained from three independent experiments. All results are expressed as mean ± SD (one-way ANOVA followed by Turkey’s post hoc test). ** p < 0.01, *** p < 0.005, **** p < 0.001. Berberine treatment group was compared with the control group and the 6-OHDA-only treatment group.

