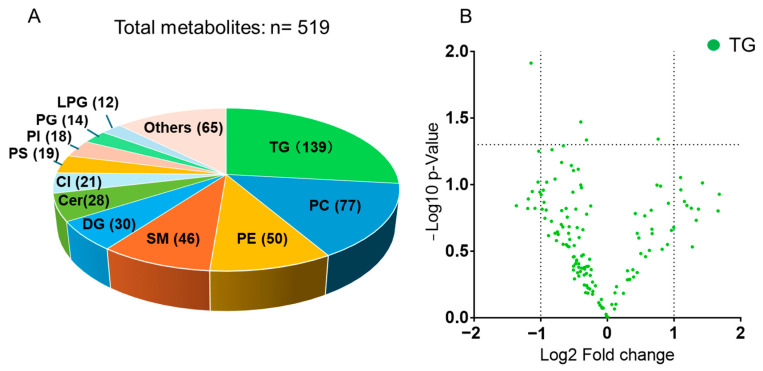
Figure 1.
Overview of detected metabolites and distribution of triacylglycerols (TGs). (A) We identified 519 lipid metabolites. The number in parentheses following each lipid class indicates the number of detected metabolites in that class. TGs comprised the predominant class (139 species) (n = 5/group). (B) Volcano plot of TGs showing the log2 fold change (TAC group/control group) on the x-axis and the –log10 p-value on the y-axis. Each green dot represents an individual TG species. The two vertical dotted lines indicate −1 and 1 for Log2 Fold change, respectively. The horizontal dotted line indicates a p-value of 0.05. Abbreviations: Cer: ceramide; Cl: cardiolipin; DG: diacylglycerol; LPG: lysophosphatidylglycerol; PC: phosphatidylcholine; PE: phosphatidylethanolamine; PG: phosphatidylglycerol; PS: phosphatidylserine; SM: sphingomyelin; Pl: phosphatidylinositol; TG: triacylglycerol.

