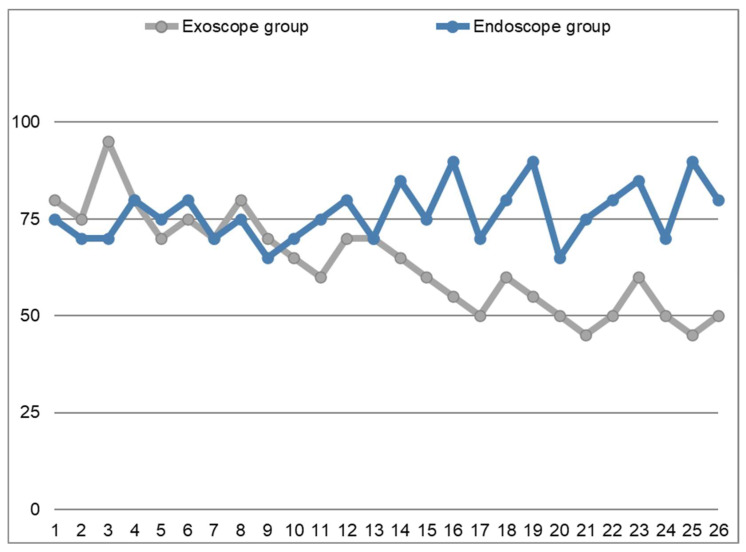
Figure 3.
The x-axis represents the patients from the two case series, while the y-axis indicates operative times expressed in minutes; in the endoscopic group (blue line) operative times remain stable, initially slightly higher than those in the exoscopic group (grey line); however, following a period of partial overlap, operative times in exoscopic group ultimately became shorter than those in the endoscopic group; the grey line corresponds to the learning curve of the exoscope-guided septoplasty procedure. Operative Time: Duration of the procedure in minutes.

