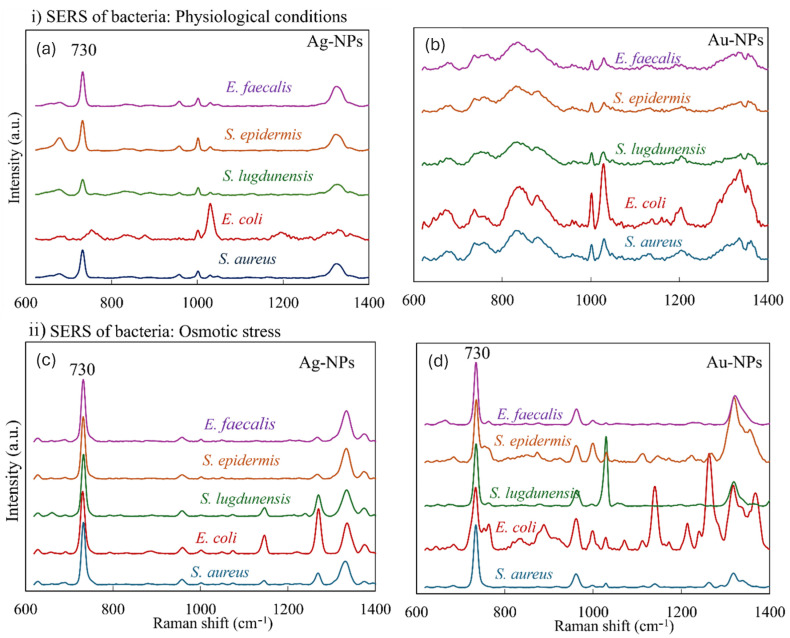
Figure 5.
(i) The SERS spectra of bacteria with NPs in physiological conditions. The figure presents SERS spectra of bacterial cells with Au-NPs and Ag-NPs. (a) Bacterial suspension with Ag-NPs; (b) bacterial suspension with Au-NPs. (ii) The SERS spectra of bacteria with NPs in osmotic stress caused by DI water. (c) Bacterial suspension with Ag-NPs; (d) bacterial suspension with Au-NPs. A dominant peak of adenine was observed at 730 cm−1. Averaged from 10 spectra per sample. The spectra were normalized to the adenine peak at 730 cm−1.

