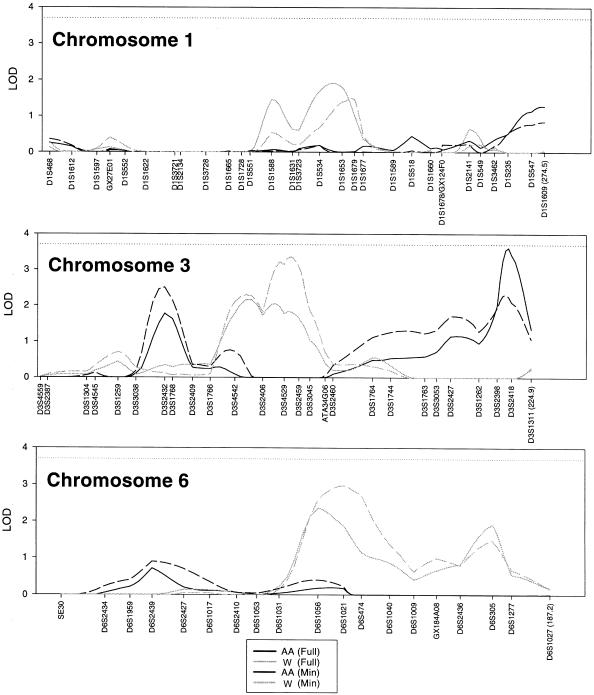
Figure 1.
Results of the multipoint linkage analysis for African Americans (AA) and whites (W) for both the minimally adjusted and fully adjusted residual creatinine-clearance models. Each scanned marker is given, along the x-axis, at its respective distance (in cM) from the p-telomere (left) to the q-telomere (right), and the distance (in cM) of the last marker is given in parentheses.

