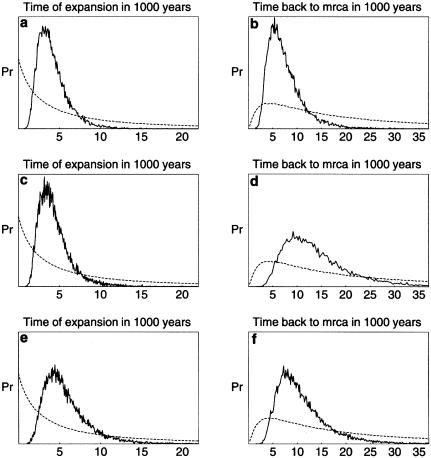
Figure 5.
Bayesian-based demographic inference of associated Y-chromosome STR variation concerning the DYS390.1del/RPS4Y711T haplotype (a and b), the M119C/M9G haplotype (c and d), and the M4G/M5T/M9G haplotype (e and f). Prior probabilities (dashed lines) and posterior-probability distributions (continuous lines) are shown for the time when population expansion began (a, c, and e) and for the TMRCA (b, d, and f).

