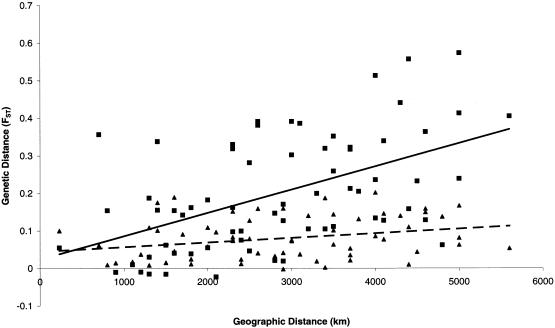
Figure 7.
Correlation analysis of genetic distance (FST based on SNP markers) and geographic distance (km), for 12 populations from eastern/southeastern Asia, Melanesia, and Australia (for particular populations, see the text), for mtDNA (triangles, dashed trendline) and Y-chromosome DNA (squares, continuous trendline).

