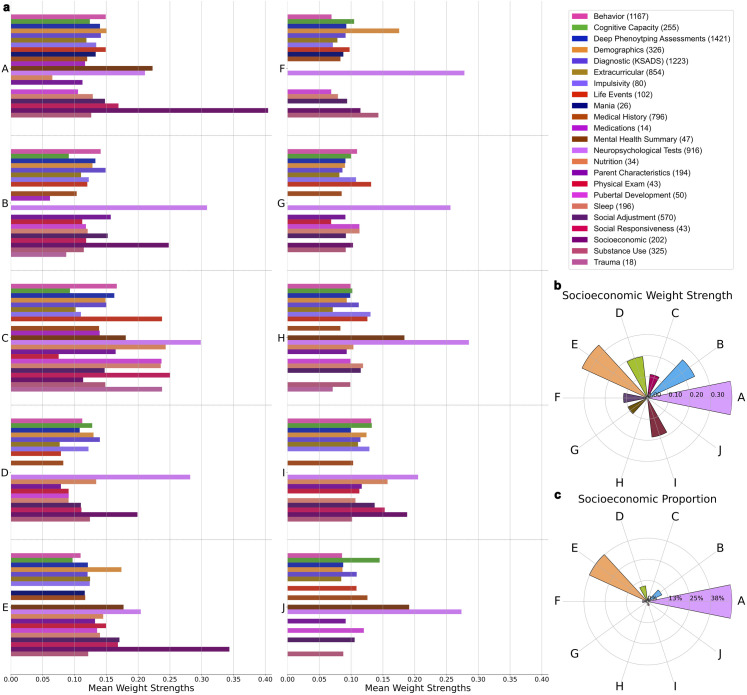
Fig 2. Population variation is driven by distinct combinations of phenotype categories with SES as a central theme.
a) Weight strength colored by category in each of the top 10 components. The number of variables per category is listed in brackets next to each category name in the legend. Category mean weight strength is calculated by averaging all individual phenotype weight strengths (retained after thresholding) within a predefined category. The Socioeconomic (SES) category has the highest or second highest mean weight strength of all categories in 4 of the top 5 most explanatory components. The Neuropsychological Tests category also exhibits consistently high mean weight strength across the top 10 components. b) Radial plot illustrating that the SES category has the highest mean weight strength in 4 of the top 5 most explanatory components (A, B, D, E) compared to the remainder of the top 10 components. c) Radial plot revealing that the phenotypes driving the SES category are distributed amongst 4 of the top 5 most explanatory components (A, B, D, E) in a higher proportion compared to the remainder of the top 10 components.

