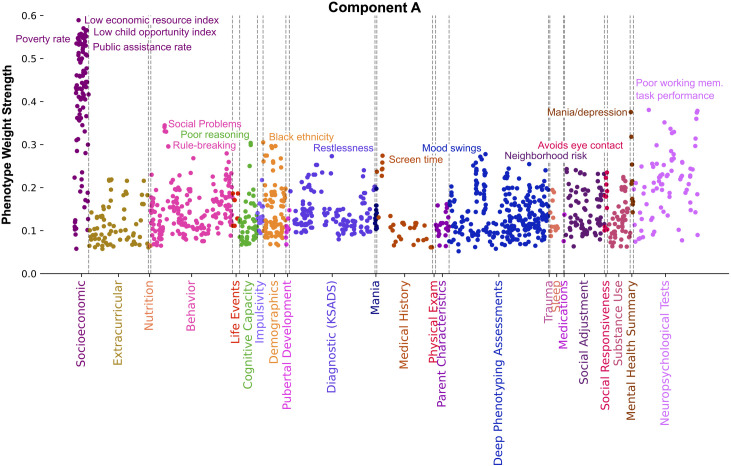
Fig 4. Component A distinctly captures material poverty and its health and mental well-being correlates.
Manhattan plot shows phenotypes, colored by category, whose weight strength in component A rank in the 95th percentile among all 100 components. Weight strength is calculated as the magnitude of Pearson’s correlation coefficient between participant data variable and latent variable scores. Socioeconomic measures exhibiting the strongest weight relate to high poverty and public assistance rates as well as low economic resources and child opportunity levels. Other phenotypes exhibiting strong weight relate to poor working memory task performance, poor reasoning, mood swings, indicators of mania and depression, restlessness, social interaction difficulties, rule breaking behavior, Black ethnicity, neighborhood risk, and high screen time. Collectively, this component proposes a connection between economic resources, deviant social behavior, and mental and emotional well-being.

