
FIGURE 2.
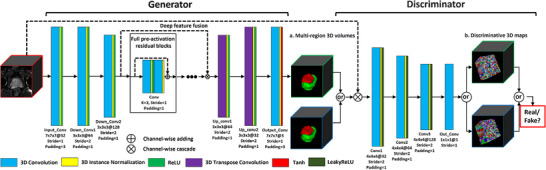
The detailed schematic diagram of ProZonaNet (The input, output, and annotation volumes are represented by red, green, and blue edged cubes, respectively. The 3D discriminative maps of the discriminator for synthetic or real regions of interest are also represented by green‐ and blue‐edged cubes, respectively).