

Abstract
This study examined whether better state LTSS performance in caregiver support (LTSS-CG), independent of LTSS spending, is associated with lower hospitalizations among community-welling older adults with dementia. Using Health and Retirement Study data (2012–2020) linked to the LTSS-CG state rankings, we analyzed hospitalization outcomes (any hospitalization, total hospital nights, total stays) for 6,755 participants. Multivariable regression models showed that worse LTSS-CG rankings were significantly associated with increased hospitalizations. Compared to states with “Excellent” LTSS-CG rankings, the odds of hospitalization were 35.13%, 36.09%, and 46.69% higher for “Good,” “Fair,” and “Poor” categories, respectively. Similarly, hospital stays and nights increased across lower-ranking categories. Findings suggest that better LTSS-CG is associated with lower hospitalization risks, highlighting the importance of accessible, high-quality LTSS for caregiver support in improving health outcomes and lowering dementia-related healthcare costs. This underscores the need for policies promoting caregiver support to foster healthy aging.
Keywords: Long-Term Services and Supports, family caregivers, hospitalization, dementia
Introduction
Long-Term Services and Supports (LTSS) encompass a broad range of assistance and care provided over an extended period, typically to individuals with functional limitations and chronic illnesses. The objective of LTSS is to help people maintain their independence and quality of life while addressing their specific needs. These services can include personal care, assistance with daily activities, skilled nursing care, therapy, and various forms of support to enable individuals to function well in their preferred living environment (Colello et al., 2013; Thach & Wiener, 2018). Medicaid is the primary source of funding for LTSS for low-income adults, and the quality and availability of LTSS vary significantly across states (Thomas & Applebaum, 2015). Consequently, the American Association of Retired Persons (AARP) Public Policy Institute developed the LTSS State Scorecard (The Scorecard), which measures and ranks the quality and affordability of LTSS across states (AARP Public Policy Institute, n.d.). State rankings highlight variations in performance in terms of delivering LTSS to its older and disabled population to assist policymakers, advocates, and the public in understanding the strengths and weaknesses of each state’s LTSS system.
There is a focus on Home and Community-Based Services (HCBS) among state LTSS programs, which emphasizes delivering care and support in non-institutional settings, such as people’s homes (Murray et al., 2021). HCBS prioritizes individual autonomy, aiming to create environments where individuals can receive necessary assistance while remaining integrated within their communities. Specifically, HCBS encompasses a range of services such as home health care and personal assistance, under different waiver and state programs (Kitchener et al., 2005; Miller, 2011). While LTSS caters to a diverse population, older adults—a population that continues to grow in the United States (Colby et al., 2015; U.S. Census Bureau, 2018, March 13)—constitute a significant proportion of its recipients. Existing research has highlighted a positive impact of increased state HCBS spending on improved health outcomes among disabled older adults, such as fewer end-of-life transfers to nursing homes (Muramatsu et al., 2008), and efforts to redirect Medicaid financial resources from institutional care to HCBS have shown promise for improved outcomes (Cheng et al., 2024). However, there exists a gap in understanding the independent influence of state LTSS rankings on the health outcomes of community-dwelling older adults.
LTSS state rankings are established across five domains: Affordability and Access, Choice of Setting and Provider, Quality of Life and Quality of Care, Support for Family Caregivers, and Effective Transitions. An Overall state rank, which is the average of the five individual ranks is also included in The Scorecard. Each dimension incorporates specific indicators to holistically assess and rank state performance in providing LTSS (AARP Public Policy Institute, n.d.). We have included a detailed description of the individual indicators that are used to construct rankings for each dimension in the Supplemental File S1.
Our research centers on the Support for Family Caregivers LTSS ranking dimension (LTSS-CG). Family caregivers of persons with dementia play a crucial role in managing both the medical and daily living needs of their loved ones, often serving as the primary coordinators of care. However, they face numerous caregiving burdens, psychological stress, and financial difficulties that can significantly affect the quality of care provided and, in turn, the health outcomes of persons with dementia. In the U.S., there was over 11 million informal caregivers for individuals with Alzheimer’s Disease and Related Dementias (ADRD) in 2023 (Alzheimer’s Association, 2024); (Mueller et al., 2022). A study of 1,300 adult child caregivers found that their health is significantly impacted not only by their caregiving responsibilities but also by the added pressures of juggling other roles, such as being a spouse, parent, and employee (Barnett, 2015; Chiao et al., 2015). Patients’ neuropsychiatric symptoms, which are commonly associated with dementia, are significant predictors of caregiver burden, and there is an association between the number of tasks performed and the level of burden (Cheng, 2017; Riffin et al., 2017). Employed caregivers report worse health and higher depressive symptoms compared to retired caregivers (Kohl et al., 2019). Caregivers of older adults living with dementia also experience financial hardships, due to their caregiving demands, leading to lower wealth accumulation. This financial strain is even more significant among unmarried adult children and those without siblings (Arora, 2016). Collectively, these findings underscore the need for psychosocial interventions and healthcare support to assist caregivers and mitigate the adverse effects of their roles.
Supporting caregivers is crucial, as evidence shows it directly enhances the quality of life and health outcomes for older adults with dementia. Caregiver challenges can be mitigated through interventions such as counseling, support groups, behavioral strategies, mindfulness practices, hiring paid services, and assistance with daily tasks like transportation. These programs help balance the demands on caregivers with available resources, improve their skills, and foster positive interactions with care recipients, ultimately enhancing caregiver well-being and delaying the institutionalization of those with dementia (National Academies of Sciences, 2016a).
This study primarily aims to determine whether, even after adjusting for HCBS and total LTSS spending, as well as overall state LTSS system performance, improved state support for family caregivers is associated with a reduced risk of hospitalization among community-dwelling older adults living with dementia. We focused on hospitalization as an outcome measure because of its significant implications for the health and well-being of older adults with dementia, as well as its substantial financial impact on healthcare systems (Anderson et al., 2020; Becker et al., 1987; Graf, 2006).
Methods
Data sources
We utilized multiple datasets spanning the years 2010 to 2020. To mitigate the challenges posed by temporal variations and data availability, we carefully selected datasets from different years, striving for maximal alignment and consistency among the datasets. Individual-level demographic and health-related data were obtained from the 2012, 2014, 2018, and 2020 Health and Retirement Study (HRS) surveys (Fisher & Ryan, 2018). The HRS is a comprehensive, longitudinal panel survey that has been conducted biennially since 1992, targeting Americans aged 50 and older. This household survey is designed to be nationally representative using a multi-stage area probability design, and it captures data not only from the selected individuals but also from their spouses, where applicable (Sonnega et al., 2014) The geographic information of HRS respondents was used to link their data with additional county- and state-level datasets. County-level data was obtained from the 2010, 2015, 2018, and 2020 Area Health Resource Files (AHRF) by the Bureau of Health Workforce, which provides health profession and population data (Health Resources & Services Administration, 2020). The AARP published state LTSS performance scorecards of 2011, 2014, 2017, and 2020 which offered state rankings based on state-level LTSS performance metrics (AARP Public Policy Institute, n.d.). The Medicaid LTSS Annual Expenditures Reports from the fiscal years 2012, 2014, 2018, and 2020 alongside the LTSS User Brief from the Centers for Medicare & Medicaid Services (CMS) (Kim et al., 2022) provided information on state expenditures associated with LTSS and HCBS. We also obtained state-level demographic 2012, 2014, 2018, and 2020 data from the U.S. Census Bureau (U.S. Census Bureau, 2023). A detailed alignment of these data sources is provided in Supplemental File S2.
Study sample
Our sample consisted of 6,755 older adults living with dementia who participated in at least one of the four Health and Retirement Study (HRS) waves in 2012, 2014, 2018, and 2020 and were not residing in a nursing home at the time of the survey. Cognitive status was determined based on a previously validated approach that relies on self-reported and proxy-reported cognitive assessments within the HRS (Langa et al., 2017). Following this approach, cognitive status was classified into three groups: “dementia,” “cognitive impairment without dementia (CIND),” and “intact cognition.” Our sample only included respondents in the “dementia” group.
Variables
All dependent variables were defined from the HRS data. The outcome measures were three different hospital use variables: any hospitalization (binary), as well as the total nights and stays spent in hospital over the preceding two years. The binary measure of any hospitalization was derived from HRS participants’ responses to the question: “Have you been a patient in a hospital overnight?” which indicates whether participants were hospitalized during the preceding two years. Total nights spent in the hospital and total hospital stays record the total counts of nights spent in hospital and total number of hospital admissions within two years before the HRS interview, respectively. The two variables were generated by asking “How many nights were you a patient in the hospital” and “How many different times were you a patient in a hospital overnight?” respectively.
We defined the independent variables as Support for Family Caregivers state LTSS performance rankings (LTSS-CG) from The 2011, 2014, 2017, and 2020 Scorecards categorized into quartiles – excellent (top quartile/best-performing states), good, fair, and poor (bottom quartile/worst-performing states). LTSS aims to provide comprehensive, culturally appropriate support to family caregivers, recognizing them as an essential component of the program. These rankings reflect state policies that focus on supporting working family caregivers, person- and family-centered care, nurse delegation and scope of practice, as well as transportation policies (AARP Public Policy Institute, n.d.). The quartile-based categorization captures variations in state-level caregiver support, simplifying complex policy data into manageable categories to clarify the relationship between supportive environments for family caregivers and hospitalization rates.
All models controlled for individual, county, and state covariates that are commonly used in studies involving persons with dementia or other older adults in need of LTSS (Coburn et al., 2019; Muramatsu et al., 2008; Wang et al., 2022). At the individual level, we controlled for demographic and clinical characteristics including age (continuous), gender (male, female), race (non-Hispanic White, Hispanic, non-Hispanic Black, non-Hispanic other), educational attainment (no degree/GED, high school, some college, masters/professional degree), marital status (married vs. not married), employment status (unemployed, employed, retired, homemaker, other), deficits in activities of daily living – ADL limitations (no ADL limitation, at least 1 ADL limitation, missing data), deficits in instrumental activities of daily living – IADL limitations (no IADL limitation, at least 1 IADL limitation), number of chronic conditions (continuous), insurance coverage (Medicaid only, Medicare only, Medicare-Medicaid duals, private insurance only, Medicare-private insurance, VA, no insurance), and a proxy HRS interview indicator (proxy or self-reported). ADL limitations_included bathing, dressing, eating, getting in or out of bed, getting across a room, and using toilets. IADL limitations included managing money, taking medications, preparing meals, making phone calls, and shopping for groceries. To maintain data completeness, we included a “missing data” category in variables with at least 3% missing observations.
County-level covariates included indicator variables for rural versus urban county, low-education status (20% or more of county residents aged 25–64 did not have a high school diploma), low employment status (less than 65% of county residents aged 25–64 were employed), high poverty status (poverty rate of 20% or more), and a categorical variable for health professional shortage areas – HPSAs – (no shortage, partial shortage, total shortage) based on the population-to-primary care physician ratio. State-level covariates were all continuous variables and included the AARP’s Overall LTSS state rankings (“Overall” LTSS ranking), annual per capita state Medicaid LTSS spending in U.S. dollars (State Medicaid LTSS spending per capita), Medicaid spending on HCBS as a percentage of total Medicaid spending on LTSS (State %HCBS/LTSS), and the percentage of older adults aged 65 and above (State % with 65+ years).
Statistical analysis
The descriptive analysis involved quantifying categorical variables by calculating their counts and corresponding proportions, as well as determining the means for continuous variables. These analyses were conducted for the entire sample and stratified by LTSS state ranking quartiles within the LTSS-CG (Table 1). For the stratified analyses, ANOVA was utilized to compare differences across the quartiles. We also calculate the average of each outcome measure by LTSS-CG quartile for an unadjusted comparison of the three outcome measures across LTSS-CG quartiles (Figure 1). Multivariable regression models were performed to examine the independent relationships between outcome variables and quartiles the LTSS-CG. To account for repeated measures across different years, we utilized panel data analyses with random effects for individual participants. Specifically, logistic regression models (xtlogit) were applied for the binary outcome variable: any hospitalization in the past two years. Negative binomial models (xtnbreg) were used for the count outcomes, including total nights spent in the hospital and total hospital stays in the preceding two years. In each model, the independent variable was the LTSS-CG in quartiles, in which the “Excellent” quartile served as the reference category. All regression models controlled for state, county, and individual covariates, and the robust Huber-White standard errors were applied to account for within-patient variations. P-values of less than 0.05 were considered statistically significant. All analyses were conducted in StataNow/MP 18.5.
Table 1:
Sample characteristics
| Variables | Entire sample characteristics (N=6,755) | Sample characteristics aggregated by “Support for Family Caregivers” LTSS ranking quartiles | |||
|---|---|---|---|---|---|
| Excellent (N=2,041) | Good (N=1,628) | Fair (N=1,213) | Poor (N=1,873) | ||
| Categorical variables: number of individuals in a group (percentage) | |||||
| Independent variable | |||||
| “Support for Family Caregivers” LTSS ranking | |||||
| - Excellent | 2,041 (30.2) | ||||
| - Good | 1,628 (24.1) | ||||
| - Fair | 1,213 (18.0) | ||||
| - Poor | 1,873 (27.7) | ||||
| County-level covariates | |||||
| Health Professional Shortage Areas (HPSA) | |||||
| - No shortage | 521 (7.7) | 124 (6.1) | 160 (9.8) | 79 (6.5) | 158 (8.4) |
| - Total shortage | 816 (12.1) | 97 (4.7) | 194 (11.9) | 301 (24.8) | 224 (12.0) |
| - Partial shortage | 5,418 (80.2) | 1,820 (89.2) | 1,274 (78.3) | 833 (68.7) | 1,491 (79.6) |
| Low education | 965 (14.3) | 454 (22.2) | 235 (14.4) | 180 (14.8) | 96 (5.1) |
| Low employment | 861 (12.8) | 164 (8.0) | 155 (9.5) | 261 (21.5) | 281 (15.0) |
| High poverty | 1,398 (20.7) | 365 (17.9) | 394 (24.2) | 360 (29.7) | 279 (14.9) |
| Urban county | 5,638 (83.5) | 1,835 (89.9) | 1,227 (75.4) | 929 (76.6) | 1,647 (87.9) |
| Individual-level covariates | |||||
| Male | 2,769 (41.0) | 808 (39.6) | 683 (42.0) | 521 (43.0) | 757 (40.4) |
| Race/Ethnicity | |||||
| Non-Hispanic White | 4,045 (60.0) | 1,191 (58.5) | 938 (57.7) | 679 (56.2) | 1,237 (66.1) |
| Hispanic | 924 (13.7) | 406 (20.0) | 252 (15.5) | 120 (9.9) | 146 (7.8) |
| Non-Hispanic Black | 1,520 (22.6) | 343 (16.8) | 380 (23.4) | 366 (30.3) | 431 (23.1) |
| Non-Hispanic other | 252 (3.7) | 96 (4.7) | 56 (3.4) | 44 (3.6) | 56 (3.0) |
| Education | |||||
| No degree/GED | 2,113 (31.3) | 570 (27.9) | 586 (36.0) | 461 (38.0) | 496 (26.5) |
| High school | 2,666 (38.0) | 736 (36.1) | 577 (35.4) | 491 (40.5) | 762 (40.7) |
| Some college | 1,240 (18.4) | 433 (21.2) | 268 (16.5) | 178 (14.7) | 361 (19.3) |
| Masters/professional degree | 687 (10.1) | 243 (11.9) | 164 (10.1) | 69 (5.7) | 211 (11.2) |
| Missing education data | 149 (2.2) | 59 (2.9) | 33 (2.0) | 14 (1.1) | 43 (2.3) |
| Legally married | 3,431 (50.8) | 1,083 (53.1) | 819 (50.3) | 568 (46.9) | 961 (51.3) |
| Employment | |||||
| Unemployed | 204 (3.0) | 78 (3.9) | 51 (3.1) | 28 (2.3) | 47 (2.5) |
| Employed | 1,422 (21.2) | 488 (24.1) | 337 (20.8) | 180 (14.9) | 417 (22.4) |
| Retired | 3,577 (53.2) | 1,058 (52.3) | 844 (52.1) | 678 (56.1) | 997 (53.4) |
| Homemaker | 455 (6.8) | 118 (5.8) | 109 (6.7) | 98 (8.1) | 130 (7.0) |
| Other | 1,062 (15.8) | 282 (13.9) | 280 (17.3) | 225 (18.6) | 275 (14.7) |
| ADL | |||||
| No ADL | 3,882 (57.5) | 1,205 (59.0) | 912 (56.0) | 633 (52.2) | 1,132 (60.5) |
| At least 1 ADL | 2,039 (30.2) | 581 (28.5) | 504 (31.0) | 446 (36.8) | 508 (27.1) |
| Missing ADL data | 834 (12.3) | 255 (12.5) | 212 (13.0) | 134 (11.0) | 233 (12.4) |
| IADL | |||||
| No IADL | 1,833 (27.1) | 488 (23.9) | 460 (28.3) | 423 (34.9) | 462 (24.7) |
| At least 1 IADL | 4,922 (72.9) | 1,553 (76.1) | 1,168 (71.7) | 790 (65.1) | 1,411 (75.3) |
| Insurance | |||||
| Medicare only | 2,266 (33.8) | 616 (30.6) | 516 (31.8) | 455 (37.8) | 679 (36.6) |
| Medicaid only | 288 (4.3) | 103 (5.1) | 77 (4.8) | 56 (4.7) | 52 (2.8) |
| Medicare-Medicaid duals | 898 (13.4) | 269 (13.3) | 224 (13.8) | 178 (14.8) | 227 (12.2) |
| Private insurance only | 1,147 (17.1) | 419 (20.8) | 277 (17.1) | 139 (11.5) | 312 (16.8) |
| Medicare-private insurance | 1,365 (20.4) | 400 (19.9) | 322 (19.9) | 252 (20.9) | 391 (21.0) |
| VA | 354 (5.3) | 95 (4.7) | 100 (6.2) | 49 (4.1) | 110 (5.9) |
| No insurance | 379 (5.7) | 113 (5.6) | 104 (6.4) | 75 (6.2) | 87 (4.7) |
| Proxy HRS interview | 971 (14.4) | 246 (12.1) | 255 (15.7) | 223 (18.4) | 247 (13.2) |
| Continuous variables: mean (standard deviation) | |||||
| State-level covariates | |||||
| state %HCBS/LTSS | 53.2 (10.4) | 52.3 (9.4) | 54.7 (9.3) | 52.8 (10.3) | 53.0 (12.1) |
| State Medicaid LTSS spending per capita | 481.2 (1,215.9) | 440.8 (1,304.4) | 626.5 (1,134.9) | 759.4 (1,195.4) | 218.6 (365.8) |
| State % with 65+ years | 16.3 (2.3) | 16.3 (2.1) | 15.2 (2.1) | 16.0 (1.8) | 17.6 (2.4) |
| “Overall” LTSS ranking | 26.9 (15.3) | 13.0 (9.2) | 25.5 (13.4) | 30.1 (10.9) | 41.1 (9.9) |
| Individual-level covariates | |||||
| Age | 71.9 (11.7) | 70.8 (11.7) | 71.8 (11.9) | 73.2 (11.6) | 72.2 (11.5) |
| Chronic conditions | 2.43 (1.6) | 2.3 (1.5) | 2.4 (1.6) | 2.6 (1.5) | 2.5 (1.6) |
Except for male (p=0.215), legally married (p=0.007), and ADL(p=0.025), all p-values in ANOVA were p<0.001.
Figure 1.
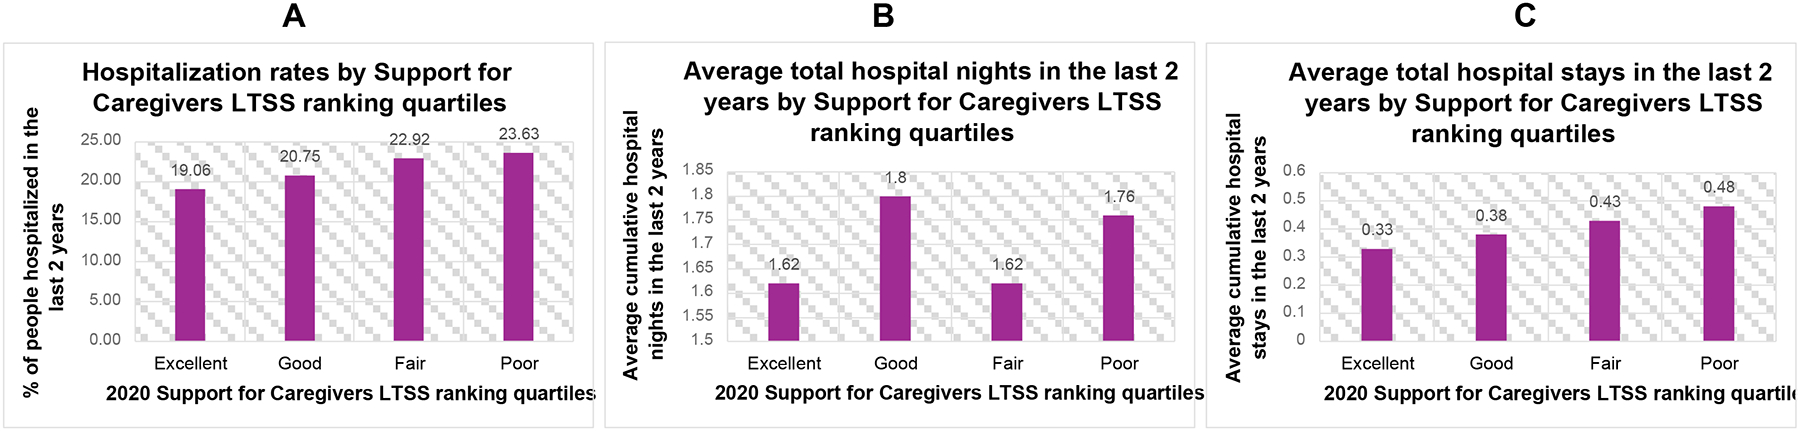
Average outcome measures by Support for Caregivers LTSS ranking quartiles from the 2020 LTSS state performance scorecard: (A) hospitalization rates, (B) total hospital nights, (C) total hospital stays
Results
Table 1 presents detailed sample characteristics. The average age in our sample was 71.9, and the majority was non-Hispanic White (60%), female (59%), legally married (50.8%), retired (53.2%), Medicare only insured (33.8%), had no ADL limitations (57.5%), and had at least 1 IADL limitations (72.9%), and the average number of chronic conditions was 2.43. Figure 1 shows the average of each outcome measure by state LTSS-CG performance quartile groups from the 2020 Scorecard. This raw comparison of hospital use measures across quartiles reveals discernible trends of increased hospital use patterns as state LTSS-CG decrease, suggesting unadjusted associations between lower state LTSS-CG performance and increased hospital utilization among community-dwelling older adults living with dementia, with some nuances in specific hospital use metrics. Similar patterns were observed in the analyses of the 2011, 2014, and 2017 scorecards (Supplemental File S3).
The multivariable results presented in Table 2 show that worse LTSS-CG state rankings were significantly associated with an increased risk of hospitalization, increased total number of hospital stays, and increased total number of nights spent in hospitals. After controlling for the relevant state, county, and individual covariates, and compared to the reference category of “Excellent” LTSS-CG ranking for caregiver support, the odds of hospitalization were 35.13% higher for the “Good” category (AOR[95% CI]: 1.35[1.09, 1.67], p=0.005), 36.09% higher for the “Fair” category (AOR[95% CI]: 1.36[1.07, 1.73], p=0.012), and 46.69% higher for the “Poor” category (AOR[95% CI]: 1.47[1.12, 1.93], p=0.006). Moreover, the incidence rates of hospital stays increased significantly across lower LTSS-CG ranking categories. The incidence rate ratio (IRR) for hospital stays was 32.33% higher for the “Good” category (IRR[95% CI]: 1.32[1.15, 1.53], p<0.001), 32.16% higher for the “Fair” category (IRR[95% CI]: 1.32[1.12, 1.56], p=0.001), and 42.00% higher for the “Poor” category (IRR[95% CI]: 1.42 [1.18, 1.72], p<0.001) when compared to the “Excellent” category. Similarly, the incidence rates for hospital nights were notably higher for lower LTSS-CG ranking categories: 24.76% higher (IRR[95% CI]: 1.25[1.08, 1.44], p=0.002) for the “Good” category, 24.45% higher (IRR [95% CI]: 1.24[1.06, 1.46], p=0.007) for the “Fair” category, and 31.52% higher (IRR [95% CI]: 1.32[1.10, 1.57], p=0.003) for the “Poor” category, all compared to the “Excellent” category. Supplemental File S4 shows detailed estimates for all the variables included in the three multivariable regression models.
Table 2:
Association between Support for Family Caregivers state LTSS ranking quartiles and the outcomes of interest (N = 6,755)a
| LTSS ranking quartiles/Outcome | Good | Fair | Poor | |||
|---|---|---|---|---|---|---|
| OR/IRR (95% CI) | P value | OR/IRR (95% CI) | P value | OR/IRR (95% CI) | P value | |
| Hospitalization | 1.35 (1.09, 1.67) | 0.005 | 1.36 (1.07, 1.73) | 0.012 | 1.47 (1.12, 1.93) | 0.006 |
| Number of Hospital Stays | 1.32 (1.15, 1.53) | <0.001 | 1.32 (1.12, 1.56) | 0.001 | 1.42 (1.18, 1.72) | <0.001 |
| Number of Hospital Nights | 1.25 (1.08, 1.44) | 0.002 | 1.24 (1.06, 1.46) | 0.007 | 1.32 (1.10, 1.57) | 0.003 |
Adjusted for state Medicaid LTSS spending per capita, state Medicaid spending on HCBS as a percentage of total Medicaid spending on LTSS, state percentage of older adults, Overall LTSS state rankings, the county-level rural-urban indicator (binary), low education indicator (binary), low employment indicator (binary), high poverty indicator (binary), health professional shortage levels – HPSAs – (no shortage, partial shortage, total shortage), age (continuous), gender (male, female), race (non-Hispanic White, Hispanic, non-Hispanic Black, non-Hispanic other), educational attainment (no degree/GED, high school, some college, masters/professional degree), marital status (binary), employment status (unemployed, employed, retired, homemaker, other), ADL limitations (no ADL limitation, at least 1 ADL limitation, missing ADL limitations data), IADL limitations(no IADL limitation, at least 1 IADL limitation), number of preexisting conditions (continuous), and insurance coverage (Medicaid only, Medicare only, Medicare-Medicaid duals, private insurance only, Medicare-private insurance, VA, no insurance), and proxy vs. self-reported HRS interview (binary)
Discussion
Our research findings reveal a noteworthy association between improved state LTSS rankings in the LTSS-CG and a lower risk of hospitalization among community-dwelling older adults living with dementia, even after controlling for state HCBS and total LTSS spending, overall state LTSS rankings, and patient and county covariates. Our results suggest that the enhanced support for family caregivers likely contributes to better management of chronic conditions and enhanced support for daily living activities, thereby helping to prevent avoidable hospitalizations. In addition, our findings contribute to the broader discussion on the financial implications of LTSS by highlighting the potential cost savings associated with reduced hospitalizations among older adults living with dementia.
In addition to the above main findings, multivariable analyses (Supplemental File S4) revealed that factors such as advanced age, being male relative to female, having at least one ADL limitation relative to no ADL limitation, having at least one IADL limitation, and a greater number of chronic conditions are all statistically significantly linked to increased hospitalization risk. These observations align with the existing literature. For instance, previous studies have shown that older adults face a higher risk of hospitalization, which escalates with age due to the natural decline in physiological reserves and an increased vulnerability to acute and chronic health conditions (Wier et al., 2006). Moreover, gender differences in hospitalization rates have been observed, with men often exhibiting a higher risk, potentially due to a combination of behavioral, biological, and social factors that influence health status (Almagro et al., 2020). The presence of ADL and IADL limitations is also known to reflect a higher level of dependency, which is associated with increased medical care needs, thereby raising the likelihood of hospital admissions (Brown et al., 2019; Krahn et al., 2015). Lastly, the accumulation of chronic medical conditions is recognized to compound the risk of hospitalization due to associated health challenges and management complexities (Almagro et al., 2020).
There are several plausible mechanisms for our key findings of the beneficial effect of increased state support for family caregivers. Increased support for family caregivers helps to ensure that these critical care partners have the resources, education, and respite they need to provide effective care without becoming overwhelmed, which can directly influence the health and well-being of those they care for (National Academies of Sciences, 2016b). One example of such initiatives is the Caregiver Advise, Record, Enable (CARE) Act, which aims to strengthen caregivers’ roles during hospital discharge by ensuring they receive adequate training and guidance for post-discharge care (Bristol et al., 2022). The CARE act is a state-level policy and has not yet adopted by all states. By improving caregivers’ ability to manage complex medical tasks and transitions, such policies can help reduce hospital readmissions and enhance patients’ long-term health outcomes (Reinhard & Ryan, 2019). Furthermore, the LTSS performance indicators within the LTSS-CG—support for working family caregivers, person- and family-centered care, nurse delegation and scope of practice, and transportation policies—highlight specific pathways through which caregiver support can reduce hospitalization risk. For example, flexible nurse delegation laws that enable licensed nurses to assign medical tasks to trained caregivers can improve care access and reduce caregiver burden while ensuring patient safety (American Nursing Association, 2013). Transportation policies can help ensure that both caregivers and care recipients have access to essential healthcare services, such as routine check-ups or follow-up appointments, which can prevent the escalation of chronic conditions. Supporting working family caregivers with policies like paid leave or flexible work hours can help reduce caregiver stress and burnout, improving their capacity to provide consistent, high-quality care. Similarly, person- and family-centered care can help ensure that caregivers are actively involved in the care planning process, providing them with the essential tools and knowledge needed to manage their loved ones’ health effectively. Future research could examine the specific mechanisms by which each of these measures contributes to reducing hospitalization rates.
Our study is subject to some limitations. First, its observational design does not allow for the establishment of causality; therefore, we cannot definitively assert that improvements in support for family caregivers directly lead to the observed improvement in health outcomes. Our multivariable analyses might also not control for all important covariates, such as individual health behaviors and regional healthcare policies, which may affect hospital use, and thus the results might be confounded by omitted variables. Another limitation is that the LTSS-CG encompasses a wide range of components, including caregiver training, respite care, and flexible work policies. This combination makes it challenging to pinpoint which specific types of caregiver support are most responsible for the observed significant association between better LTSS-CG ranking and a reduced hospitalization risk in our study. Also, while introducing a “missing data” category for HRS variables with substantial missing values was done to preserve the completeness of our data, it could have inadvertently masked important patterns or associations in our study results. Lastly, 85.6% of the respondents in our analysis sample had self-reported HRS interviews, compared to 14.4% who had proxy interviews. Recall bias regarding past hospitalizations is a notable concern, especially for a sample of persons with dementia. Although recall bias can effectively be mitigated by using proxy respondents when using HRS data (Weir et al., 2011), the small proportion of proxies in our sample limits this approach. Future research could address this limitation by using linked Medicare administrative data to validate self-reported hospitalization information for HRS participants enrolled in Medicare, providing a more reliable measure of hospitalization measures.
Conclusion
This study of a nationally representative sample of community-dwelling older adults living with dementia reveals a significant link between better state LTSS rankings in Support for Family Caregivers and a lower likelihood of hospitalization. This association persists after controlling for state Medicaid spending on HCBS as a percentage of total Medicaid spending on LTSS, overall state LTSS rankings, as well as other patient, county, and state factors. Our findings not only underscore the importance of quality LTSS support for family caregivers in promoting the health and well-being of older adults with dementia but also highlight the potential of LTSS to contribute to more efficient use of healthcare resources by reducing avoidable acute care hospitalizations.
Supplementary Material
What this paper adds
This study is the first to examine how state LTSS rankings, specifically the Support for Family Caregivers dimension, are associated with health outcomes in community-dwelling older adults with dementia.
The study findings highlight the importance of state-level policies in improving health outcomes, demonstrating that higher rankings in Support for Family Caregivers are associated with a reduced risk of hospitalization in this population.
By focusing on a vulnerable population of older adults with dementia, the study provides novel insights into the role of caregiver support in mitigating hospitalization risk.
Applications of study findings to gerontological practice, policy and/or research
The study findings underscore the potential importance of caregiver support in community-based care for older adults with dementia, particularly in relation to hospitalization risk.
Policymakers can use these results to inform discussions about enhancing state-level LTSS policies, particularly those aimed at supporting family caregivers, to potentially improve health outcomes for older adults.
Future research could build on this work by exploring the specific mechanisms through which caregiver support policies affect health outcomes, informing targeted interventions and resource allocation.
Funding statement:
The National Institute of Aging (NIA) funded the presented research under Grant R01AG069733. The views expressed in this article are the authors’ and do not necessarily reflect the view of the NIA. The NIA was not involved in the study design, data collection, analyses, or interpretation of the result.
Footnotes
Ethical considerations: Ethical approval was not required for this study as it utilized secondary, de-identified data and was therefore exempt from ongoing review by the University of Rochester’s Research Subjects Review Board (RSRB) on 3/23/2023.
Declaration of conflicting of interest: The authors declared no potential conflicts of interest with respect to the research, authorship, and/or publication of this article
Data availability:
The data used in this study include publicly available datasets from several sources: the Area Health Resource Files (AHRF), the AARP LTSS State Scorecards, the Medicaid LTSS Annual Expenditures Reports, and the U.S. Census Bureau. Access to the Health and Retirement Study (HRS) data, which include restricted individual-level demographic and health information, requires registration and approval through the University of Michigan’s Health and Retirement Study website. Detailed information on data sources and access procedures can be found in the manuscript’s references.
REFERENCES
- AARP Public Policy Institute. (n.d.). Long-Term Services and Support State Scorecard Report Archive. https://ltsschoices.aarp.org/scorecard-report/report-archive
- Almagro P, Ponce A, Komal S, de la Asuncion Villaverde M, Castrillo C, Grau G, Simon L, & de la Sierra A (2020). Multimorbidity gender patterns in hospitalized elderly patients. PLoS One, 15(1), e0227252. 10.1371/journal.pone.0227252 [DOI] [PMC free article] [PubMed] [Google Scholar]
- Alzheimer’s Association. (2024). 2024 Alzheimer’s disease facts and figures. Alzheimer’s & Dementia: The Journal of the Alzheimer’s Association, 20(5), 3708–3821. 10.1002/alz.13809 [DOI] [PMC free article] [PubMed] [Google Scholar]
- American Nursing Association. (2013). Principles for Delegation by Registered Nurses to Unlicensed Assistive Personnel (UAP). https://www.nursingworld.org/globalassets/docs/ana/ethics/principlesofdelegation.pdf
- Anderson TS, Marcantonio ER, McCarthy EP, & Herzig SJ (2020). National Trends in Potentially Preventable Hospitalizations of Older Adults with Dementia. J Am Geriatr Soc, 68(10), 2240–2248. 10.1111/jgs.16636 [DOI] [PMC free article] [PubMed] [Google Scholar]
- Arora K (2016). How does dementia onset in parents influence unmarried adult children’s wealth. Soc Sci Med, 152, 156–165. 10.1016/j.socscimed.2016.01.042 [DOI] [PubMed] [Google Scholar]
- Barnett AE (2015). Adult child caregiver health trajectories and the impact of multiple roles over time. Res Aging, 37(3), 227–252. 10.1177/0164027514527834 [DOI] [PubMed] [Google Scholar]
- Becker PM, McVey LJ, Saltz CC, Feussner JR, & Cohen HJ (1987). Hospital-acquired complications in a randomized controlled clinical trial of a geriatric consultation team. JAMA, 257(17), 2313–2317. https://www.ncbi.nlm.nih.gov/pubmed/3553627 [PubMed] [Google Scholar]
- Bristol A, Luther B, Elmore CE, Johnson E, & Wallace AS (2022). Caregiver Inclusion in IDEAL Discharge Teaching: Implications for Transitions From Hospital to Home. Prof Case Manag, 27(4), E13–E14. 10.1097/NCM.0000000000000583 [DOI] [PMC free article] [PubMed] [Google Scholar]
- Brown RT, Diaz-Ramirez LG, Boscardin WJ, Lee SJ, Williams BA, & Steinman MA (2019). Association of Functional Impairment in Middle Age With Hospitalization, Nursing Home Admission, and Death. JAMA Intern Med, 179(5), 668–675. 10.1001/jamainternmed.2019.0008 [DOI] [PMC free article] [PubMed] [Google Scholar]
- Cheng ST (2017). Dementia Caregiver Burden: a Research Update and Critical Analysis. Curr Psychiatry Rep, 19(9), 64. 10.1007/s11920-017-0818-2 [DOI] [PMC free article] [PubMed] [Google Scholar]
- Cheng Z, Mutoniwase E, Cai X, & Li Y (2024). Higher levels of state funding for Home- and Community-Based Services linked to better state performances in Long-Term Services and Supports. Health Serv Res, 59(2), e14288. 10.1111/1475-6773.14288 [DOI] [PMC free article] [PubMed] [Google Scholar]
- Chiao CY, Wu HS, & Hsiao CY (2015). Caregiver burden for informal caregivers of patients with dementia: A systematic review. Int Nurs Rev, 62(3), 340–350. 10.1111/inr.12194 [DOI] [PubMed] [Google Scholar]
- Coburn AF, Ziller EC, Paluso N, Thayer D, & Talbot JA (2019). Long-Term Services and Supports Use Among Older Medicare Beneficiaries in Rural and Urban Areas. Res Aging, 41(3), 241–264. 10.1177/0164027518824117 [DOI] [PubMed] [Google Scholar]
- Colby S, Ortman JM, & Bureau USC (2015). Projections of the size and composition of the U.S. population: 2014 to 2060. U.S. Department of Commerce, Economics and Statistics Administration, U.S. Census Bureau. https://www.census.gov/content/dam/Census/library/publications/2015/demo/p25-1143.pdf [Google Scholar]
- Colello KJ, Mulvey J, & Talaga SR (2013). Long-Term Services and Supports: Overview and Financing (CRS Report for Congress R42345). https://core.ac.uk/reader/71126640
- Fisher GG, & Ryan LH (2018). Overview of the Health and Retirement Study and Introduction to the Special Issue. Work Aging Retire, 4(1), 1–9. 10.1093/workar/wax032 [DOI] [PMC free article] [PubMed] [Google Scholar]
- Graf C (2006). Functional decline in hospitalized older adults. Am J Nurs, 106(1), 58–67, quiz 67–58. 10.1097/00000446-200601000-00032 [DOI] [PubMed] [Google Scholar]
- Health Resources & Services Administration. (2020). Area Health Resources Files https://data.hrsa.gov/data/download
- Kim M-Y, Weizenegger E, & Wysocki Andrea. (2022). Medicaid Beneficiaries Who Use Long-Term Services and Supports: 2019. https://www.medicaid.gov/medicaid/long-term-services-supports/downloads/ltss-user-brief-2019.pdf
- Kitchener M, Ng T, Miller N, & Harrington C (2005). Medicaid home and community-based services: national program trends. Health Aff (Millwood), 24(1), 206–212. 10.1377/hlthaff.24.1.206 [DOI] [PubMed] [Google Scholar]
- Kohl NM, Mossakowski KN, Sanidad II, Bird OT, & Nitz LH (2019). Does the Health of Adult Child Caregivers Vary by Employment Status in the United States? J Aging Health, 31(9), 1631–1651. 10.1177/0898264318782561 [DOI] [PubMed] [Google Scholar]
- Krahn GL, Walker DK, & Correa-De-Araujo R (2015). Persons with disabilities as an unrecognized health disparity population. Am J Public Health, 105 Suppl 2(Suppl 2), S198–206. 10.2105/AJPH.2014.302182 [DOI] [PMC free article] [PubMed] [Google Scholar]
- Langa KM, Larson EB, Crimmins EM, Faul JD, Levine DA, Kabeto MU, & Weir DR (2017). A Comparison of the Prevalence of Dementia in the United States in 2000 and 2012. JAMA Intern Med, 177(1), 51–58. 10.1001/jamainternmed.2016.6807 [DOI] [PMC free article] [PubMed] [Google Scholar]
- Miller NA (2011). Relations among home- and community-based services investment and nursing home rates of use for working-age and older adults: a state-level analysis. Am J Public Health, 101(9), 1735–1741. 10.2105/AJPH.2011.300163 [DOI] [PMC free article] [PubMed] [Google Scholar]
- Mueller A, Thao L, Condon O, Liebzeit D, & Fields a. B. (2022). A systematic review of the needs of dementia caregivers across care settings. Home Health Care Management & Practice, 34(2), 133–147. 10.1177/10848223211056928 [DOI] [Google Scholar]
- Muramatsu N, Hoyem RL, Yin H, & Campbell RT (2008). Place of death among older Americans: does state spending on home- and community-based services promote home death? Med Care, 46(8), 829–838. 10.1097/MLR.0b013e3181791a79 [DOI] [PMC free article] [PubMed] [Google Scholar]
- Murray C, Tourtellotte A, Lipson D, & Wysocki A (2021). Medicaid long-term services and supports annual expenditures report: Federal fiscal years 2017 and 2018. https://www.medicaid.gov/medicaid/long-term-services-supports/downloads/ltssexpenditures-2017-2018.pdf
- National Academies of Sciences, E., and Medicine. (2016a). In Schulz R & Eden J (Eds.), Families Caring for an Aging America (pp. 159–210). The National Academies Press. 10.17226/23606 [DOI] [PubMed] [Google Scholar]
- National Academies of Sciences, E., and Medicine. (2016b). Recommendations to support family caregivers of older adults. In Schulz R & Eden J (Eds.), (pp. 253–273). The National Academies Press. 10.17226/23606 [DOI] [Google Scholar]
- Reinhard SC, & Ryan E (2019). The CARE Act Implementation: Progress and Promise. AARP Public Policy Institute. https://www.hahusersgroup.org/wp-content/uploads/2021/06/The-Care-Act-Implementation-and-Progress.pdf [Google Scholar]
- Riffin C, Van Ness PH, Wolff JL, & Fried T (2017). Family and Other Unpaid Caregivers and Older Adults with and without Dementia and Disability. J Am Geriatr Soc, 65(8), 1821–1828. 10.1111/jgs.14910 [DOI] [PMC free article] [PubMed] [Google Scholar]
- Sonnega A, Faul JD, Ofstedal MB, Langa KM, Phillips JW, & Weir DR (2014). Cohort Profile: the Health and Retirement Study (HRS). Int J Epidemiol, 43(2), 576–585. 10.1093/ije/dyu067 [DOI] [PMC free article] [PubMed] [Google Scholar]
- Thach NT, & Wiener JM (2018). An Overview of Long-Term Services and Supports and Medicaid: Final Report. https://aspe.hhs.gov/sites/default/files/migrated_legacy_files//182846/LTSSMedicaid.pdf
- Thomas KS, & Applebaum R (2015). Long-term Services and Supports (LTSS): A Growing Challenge for an Aging America. Public Policy & Aging Report, 25(2), 56–62. 10.1093/ppar/prv003 [DOI] [Google Scholar]
- U.S. Census Bureau. (2018, March 13). Older people projected to outnumber children for first time in U.S. history https://www.census.gov/newsroom/press-releases/2018/cb18-41-population-projections.html
- U.S. Census Bureau. (2023). Data https://data.census.gov/all
- Wang J, Cheng Z, Kim Y, Yu F, Heffner KL, Quinones-Cordero MM, & Li Y (2022). Pain and the Alzheimer’s Disease and Related Dementia Spectrum in Community-Dwelling Older Americans: A Nationally Representative Study. J Pain Symptom Manage, 63(5), 654–664. 10.1016/j.jpainsymman.2022.01.012 [DOI] [PMC free article] [PubMed] [Google Scholar]
- Weir DR, Faul JD, & Langa KM (2011). Proxy interviews and bias in the distribution of cognitive abilities due to non-response in longitudinal studies: a comparison of HRS and ELSA. Longitudinal and life course studies, 2(2), 170. 10.14301/llcs.v2i2.116 [DOI] [PMC free article] [PubMed] [Google Scholar]
- Wier L, Pfuntner A, & Steiner C (2006). Hospital Utilization among Oldest Adults, 2008. In Healthcare Cost and Utilization Project (HCUP) Statistical Briefs. https://www.ncbi.nlm.nih.gov/pubmed/21413201 [PubMed] [Google Scholar]
Associated Data
This section collects any data citations, data availability statements, or supplementary materials included in this article.
Supplementary Materials
Data Availability Statement
The data used in this study include publicly available datasets from several sources: the Area Health Resource Files (AHRF), the AARP LTSS State Scorecards, the Medicaid LTSS Annual Expenditures Reports, and the U.S. Census Bureau. Access to the Health and Retirement Study (HRS) data, which include restricted individual-level demographic and health information, requires registration and approval through the University of Michigan’s Health and Retirement Study website. Detailed information on data sources and access procedures can be found in the manuscript’s references.