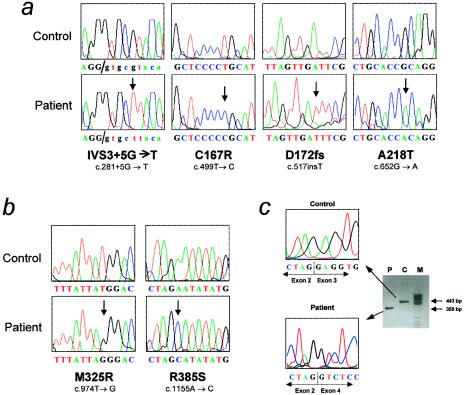
Figure 5.
Mutations in MCCA and MCCB. A, Mutations in MCCB: results of direct sequencing of PCR-amplified genomic DNA from controls and from CGB patients who have MCG are shown. Arrows indicate the mutated positions. B, Results of direct sequencing of PCR-amplified genomic DNA from controls and from CGA patients who have MCG. Arrows indicate the mutated positions. C, IVS3+5G→T MCCB mutation, which results in skipping of exon 3. The gel shows the results of agarose-gel electrophoresis and direct sequence analysis of MCCB cDNA from the region surrounding the exon2/exon3 junction, amplified by RT-PCR with fibroblast mRNA as template, from a control (lane C) and from the patient (lane P) carrying this mutation. Lane M, molecular-wieght marker.

