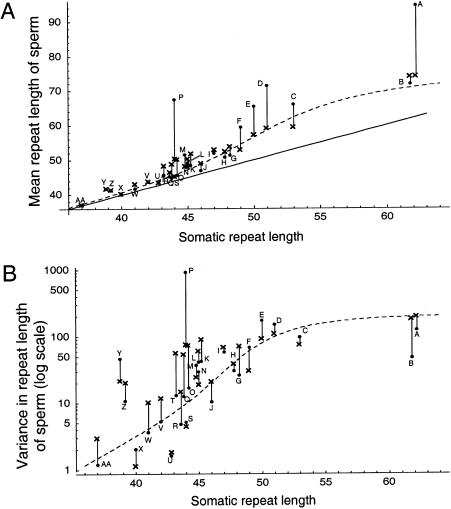
Figure 2.
Mean (A) and variance (B) of repeat-length distribution in 27 sperm-typing samples collected by Leeflang et al. (1999) (dots), compared with the corresponding values as predicted by the mitotic model (crosses). The dashed line indicates the values expected under the best-fit model with no age effect. The solid line in panel A shows the length that would be observed if all sperm were identical to somatic cells. The fact that all points are above this line shows that there is an upward bias in the germ line of each individual. The somatic repeat lengths of some samples have been displaced fractionally from integer values, to maximize their visibility on the graphs. The letters indicate the sample names used by Leeflang et al.

