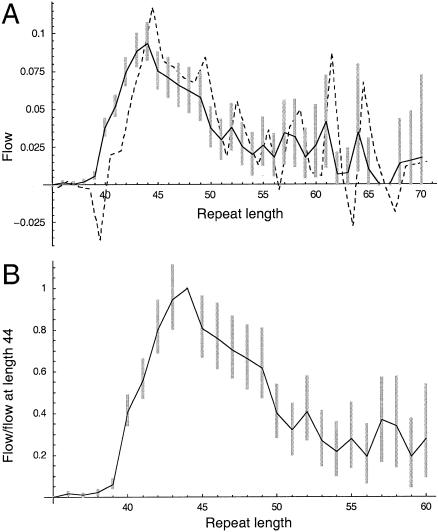
Figure 6.
Mutational flow estimated on the basis of repeat-length distribution in 1,830 disease chromosomes. A, Estimated point flow (unbroken line) and estimated differential flow (dashed line). Because they have a high sampling variance, repeat lengths >70 are not shown. B, Ratio (point flow at length x)/(point flow at length 44) (unbroken line). The ratio provides an estimate of the degree of underascertainment for repeat lengths >44. Bars indicate 95% confidence limits, calculated by means of a percentile bootstrap.

