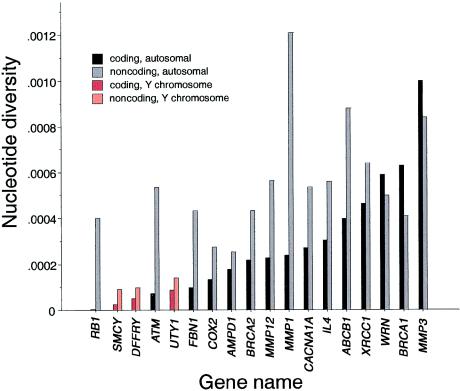
Figure 4.
Nucleotide diversity in coding and noncoding regions of 15 autosomal and 3 Y-chromosome genes. Nucleotide diversity, or heterozygosity, was calculated as described in the Subjects, Material, and Methods section. Autosomal genes are shown in black and gray, and Y-chromosome genes are shown in red and pink.

