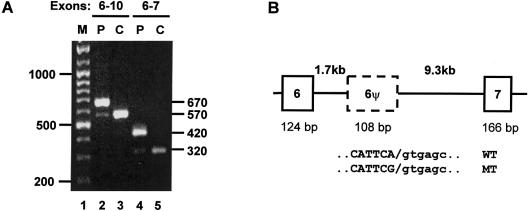
Figure 2.
Pseudoexon inclusion demonstrated in cDNA from a patient, but not from a control. A, mRNA was extracted from patient and control skin fibroblasts, and cDNA was generated using MMLTV reverse transcriptase (Promega). PCR amplification was achieved by a nested PCR, using primers in exons 2 and 10 in first rounds and 6 and 10 (lanes 2 and 3) or 6 and 7 (lanes 4 and 5) in second rounds. Products obtained from the patient (P) or control (C) are indicated above the lanes. Sizes (in bp) of the markers (M) are given on the left of the gel, and sizes of the PCR products are given on the right. B, Scheme of the genomic structure between exons 6 and 7, derived from long PCR through use of the Extensor Long PCR system (Advanced Biotechnologies). Boxes represent exons, the dashed box represents the pseudoexon, and horizontal lines represent introns. Intron lengths (in kb) are given above the diagram in bold type, and exon lengths (in bp) are given below the diagram. The sequences of the wild-type (WT) and mutant (MT) pseudoexon (in capital letters) and the flanking intronic 5′ splice site (in lowercase letters) is shown below. The slash (/) indicates the cleavage site.

