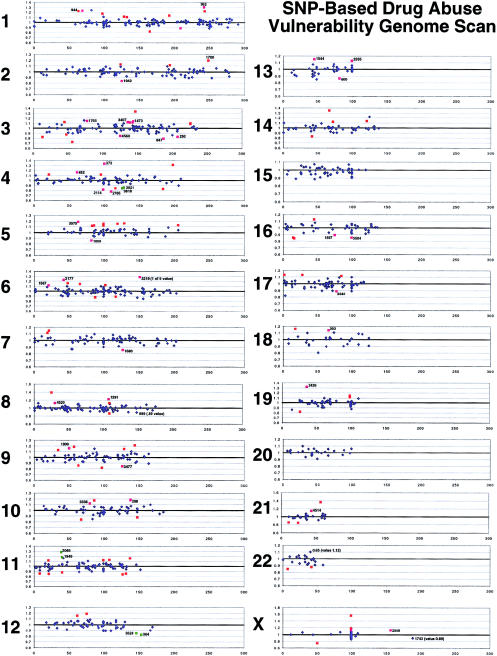
Figure 1.
Chromosome-by-chromosome distribution (labels 1–22 and X) of abuser/control ratios (y-axis) for SNPs positioned according to their average radiation-hybrid chromosomal distance in centimorgans (x-axis). Abuser/control ratios shown are from the European American sample. Red symbols indicate SNPs with results in the upper or lower 5% of the distribution of values. Labeled symbols indicate SNPs with outlying abuser/control values in both European American and African American samples. Green symbols indicate the positions of reproducibly positive SNPs with adjacent chromosomal positions, on the basis of NCBI Mapviewer coordinates.

