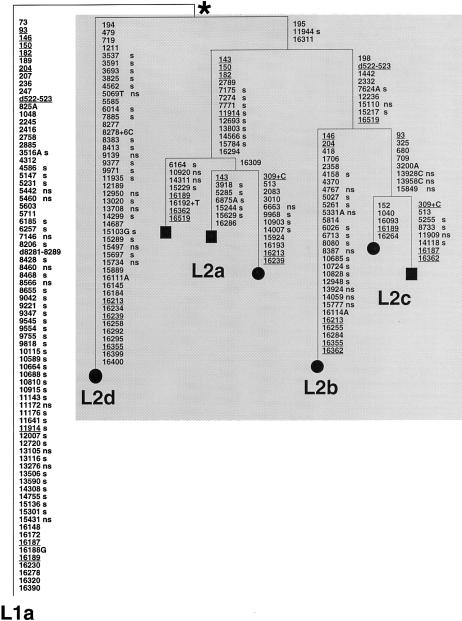
Figure 2.
Most-parsimonious reconstruction of the character evolution on a most-parsimonious tree of complete L2 sequences, rooted by use of a complete haplogroup L1a sequence. This tree includes the four L2 mtDNAs sequenced in the course of the present study (blackened circles) and the three L2 complete sequences (blackened squares) previously reported by Ingman et al. (2000). The L1a sequence used as an outgroup, as suggested by the phylogenies of Watson et al. (1997) and Ingman et al. (2000), was also obtained in the course of the present study and is from a Dominican subject. Mutations are shown on the branches; they are transitions, unless the base change is explicitly indicated. Deletions are indicated by a “d” preceding the deleted nucleotides. Insertions are indicated by a plus sign (+) preceding the number and type of inserted nucleotides. Underlining indicates recurrent mutations. “s” indicates synonymous mutations, whereas “ns” indicates nonsynonymous mutations. The asterisk (*) indicates the most recent common ancestor of the L2 mtDNAs in our sample. This differs from the revised CRS (Andrews et al. 1999) by mutations (transitions unless otherwise indicated) at the following positions: 73, 146, 150, 152, 182, 263, 315+C, 750, 769, 1018, 1438, 2416, 2706, 3594, 4104, 4769, 7028, 7256, 7521, 8206, 8701, 8860, 9221, 9540, 10115, 10398, 10873, 11719, 12705, 13590, 13650, 14766, 15301, 15326, 16223, 16278, 16311, 16390, and 16519.

