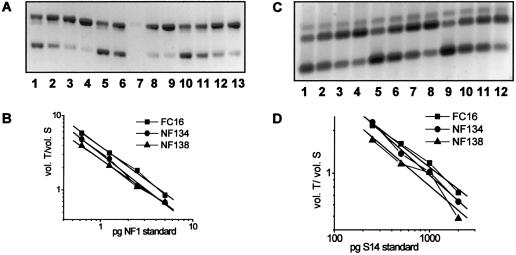
Figure 1.
Mutations of NF134-3 and of NF138-3, causing no alteration in the amount of NF1 mRNA (A and B) in relation to the expression of S14 (C and D). Fibroblasts from NF134-3, NF138-3, and a healthy donor (FC16) were seeded at a density of 4,000 cells/cm2, were cultured for 2 d, and were total-RNA isolated. For each cell culture, 4× 1 μg RNA was reverse transcribed with random hexamers and different amounts of standard RNAs for NF1 and S14 and then were PCR amplified with primer pair NF1-H/NF1-R and S14-H/S14-R. Measurement of the band intensities of the PCR products was performed as described by Kaufmann et al. (1999), with the following modification: the volume of the heteroduplex band was additionally measured, with half of its amount being added to both the volume of the transcript and the standard band. A, RT-PCR products for measurement of NF1 mRNA amounts, 1 μg of total RNA each: FC16 (lanes 1–4), NF134-3 (lanes 5–8), and NF138-3 (lanes 9–12). The products were separated on a 1.5% agarose gel stained with ethidium bromide. Lower band (345 bp), NF1 standard; middle band, heteroduplexes; upper band (395 bp), NF1 transcript. Amounts of NF1 standard RNA added: lanes 1, 5, and 9, 5 pg; lanes 2, 6, and 10, 2.5 pg; lanes 3, 7, and 11, 1.25 pg; lanes 4, 8, and 12, 0.625 pg. B, Graphical representation with linear regression for each of the NF1 mRNA measurements (vol. = integration of the volume of the band areas; T = transcript; S = standard). C, RT-PCR products for measurement of S14 mRNA amounts, 1 μg of total RNA each: FC16 (lanes 1–4), NF134-3 (lanes 5–8), and NF138-3 (lanes 9–12). The products were separated on a 1.5% agarose gel stained with SYBR-Gold. Lower band (148 bp), S14 standard; middle band (197 bp), S14 transcript; upper band, heteroduplexes. Amounts of S14 standard RNA added: lanes 1, 5, and 9, 2,000 pg; lanes 2, 6, and 10, 1,000 pg; lanes 3, 7, and 11, 500 pg; lanes 4, 8, and 12, 250 pg. D, Graphical representation with linear regression for each of the S14 mRNA measurements. Abbreviations are the same as those listed for figure 1B.

