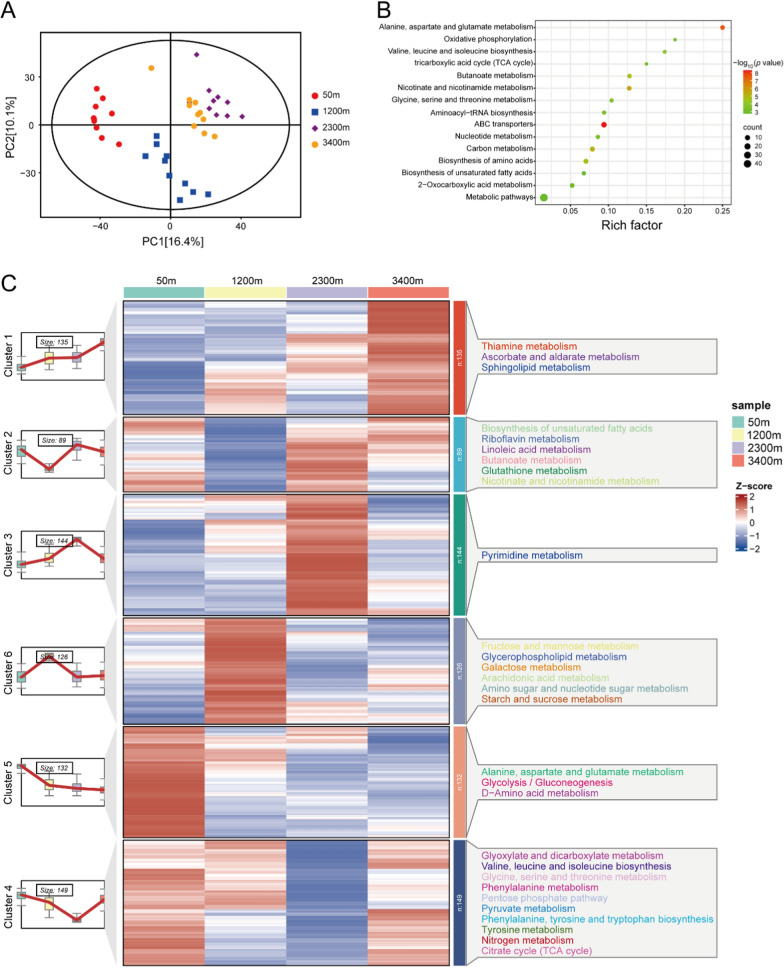
Fig. 1.
A Principal component analysis (PCA) score plot. Four groups are distinguished: 50 m altitude, red circles; 1200 m altitude, blue boxes; 2300 m altitude, purple diamonds; and 3400 m, yellow circles. B KEGG pathway enrichment analysis for differential metabolites in liver of B. gargarizans. Color shades and circle sizes represent log10(P value) and metabolite numbers, respectively. C Heat map of the expression pattern of differential metabolites in B. gargarizans at different altitudes. Red and blue colors indicate the up-regulation and down-regulation, respectively

