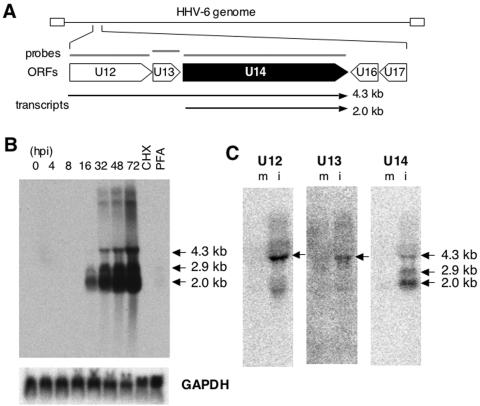
FIG. 3.
Northern blot analysis. (A) Schematic organization showing ORFs, the template for random primer synthesis of the probe (gray bars), and the transcripts detected (arrows). (B) Twenty micrograms of total RNAs extracted from HST-infected MT-4 cells at the indicated time points (hpi) and in the presence of 50 μg of CHX per ml (8 hpi) and 200 μg of PHA per ml (72 hpi) was loaded and hybridized with 32P-labeled U14 (upper panel) and glyceraldehyde-3-phosphate dehydrogenase (GAPDH) probes. (C) Twenty micrograms total RNAs from mock (m)- and HST (i)-infected MT-4 cells at 48 hpi was used to hybridize with probes against U12 and U13, and 10 μg was used for the U14 probe.

