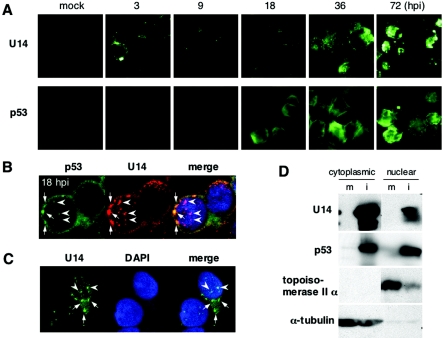
FIG. 4.
Intracellular distribution of U14. (A) Time course IFA of HST-infected Molt-3 cells harvested at the indicated time points (hpi). Acetone-fixed cells were incubated with anti-U14 and anti-p53 (DO-1) MAbs and then labeled with FITC-conjugated goat anti-mouse immunoglobulin G. (B) Confocal microscopy of HST-infected Molt-3 cells after 18 h. Anti-p53 goat PAb (FL393) and anti-U14 MAb were reacted with FITC- and tetramethyl rhodamine isothiocyanate-labeled secondary antibodies, respectively. Arrows and arrowheads indicate the cytoplasmic and nuclear dots, respectively. (C) 293 cells were transfected with the U14 expression plasmid, pEF-U14, and subjected to IFA at 24 h posttransfection. U14 was labeled with FITC-conjugated secondary antibody. Arrows and arrowheads indicate the cytoplasmic and nuclear dots, respectively. (D) Distribution of U14 and p53 in cytoplasmic and nuclear fractions. Mock (m)- and HST (i)-infected Molt-3 cells were harvested at 24 hpi and subjected to cytoplasmic and nuclear fractionation. Topoisomerase II α and α-tubulin were used as positive controls for the nuclear and cytoplasmic proteins, respectively.

