FIG. 2.
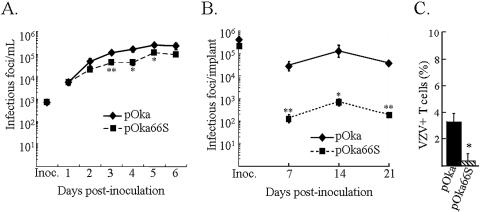
Effects of pOka66S mutation on VZV growth in vitro and in T-cell xenografts in vivo. (A) Melanoma cells were inoculated on day zero with 1 × 10³ CFU of pOka or pOkaORF66S. Two pOka66S mutant viruses were generated and tested independently. Aliquots were harvested daily for 6 days, and the number of infectious foci was determined by titration on melanoma cell monolayers. Each time point represents the mean of results for at least three wells. The x axis shows the days after inoculation when infected cell monolayers were harvested, and the y axis shows infectious foci per milliliter by infectious focus assay. One asterisk indicates that titers were significantly different from pOka (P < 0.05) at the same time point, while two asterisks indicate a difference with a P value of <0.01. (B) T-cell xenografts were inoculated with HEL fibroblasts infected with pOka or pOka66S on day zero (inoculum titers are shown on the y axis) and harvested weekly. T-cell suspensions were prepared, and titers were determined by infectious center assay. Each time point represents the mean number of plaques from two to four implants. Implants in which infectious virus was not recovered were excluded. One asterisk indicates that titers were significantly different from pOka with a P value of <0.05 at the same time point, while two asterisks indicate a difference with a P value of <0.001. (C) T cells from T-cell xenografts harvested at day 7 postinoculation with pOka or pOka66S were stained for expression of CD3 and VZV proteins and analyzed by flow cytometry. The bars indicate the percentage of VZV-positive T cells ± the standard error. One asterisk indicates a difference with a P value of <0.001.

