FIG. 1.
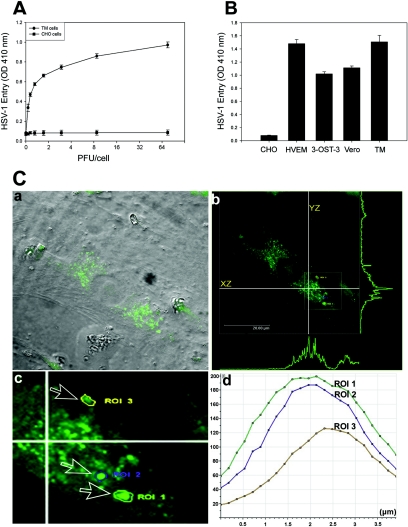
Analysis of HSV-1 entry in primary cultures of human TM cells. (A) Entry of human HSV-1 into cultured human TM cells. Cultured TM cells, along with wild-type CHO-K1 cells, were plated in 96-well plates and inoculated with twofold serial dilutions of β-galactosidase-expressing recombinant virus HSV-1 (KOS) gL86 at the PFU/cell indicated. After 6 h, the cells were washed, permeabilized, and incubated with o-nitrophenyl-β-d-galactopyranoside (ImmunoPure ONPG; Pierce) substrate for quantitation of β-galactosidase activity expressed from the input viral genome. The enzymatic activity was measured by spectrophotometer (Molecular Devices) at an optical density (OD) at 410 nm. Each value shown is the mean (± standard deviation) of three or more determinations. (B) Comparison of levels of HSV-1 entry into multiple cell types. Entry of HSV-1 into cultured human TM cells was compared to entry into naturally susceptible Vero cells and CHO-K1 cells expressing either HVEM or 3-OS HS as gD receptors. Approximately equal numbers of cells (20,000 cells per well, per Beckman counter estimate) were plated in 96-well plates at least 16 h prior to infection. All cell types were then treated with serial dilutions of β-galactosidase-expressing recombinant virus HSV-1 (KOS) gL86 for 6 h before the cells were washed and permeabilized, and substrate (ONPG) was added to measure the viral entry. The values shown (means ± standard deviations of triplicate determinations) represent the amount of reaction product detected spectrophotometrically at a single input dose of 40 PFU/cell. (C) Visualization of GFP-tagged HSV-1 (K26GFP) particles in cultured human TM cells by using confocal microscopy. Human TM cells were infected as described in the text. (a) Bright field image of cultured human TM cells overlaid with FITC fluorescent channel. Fluorescent viral capsids are seen in green. (b) Orthogonal section of the maximum projection of a z stack sliced at two different axes (xz and yz). Maximum fluorescence intensities are shown as green peaks. The inset shows the three ROI described in the text. (c) Enlarged view of the ROI (labeled and indicated by arrows). (d) Histogram of fluorescent intensities (y axis) obtained for z stacks (x axis). The total depth of the z stack was 4 μm.

