
Fig. 7.
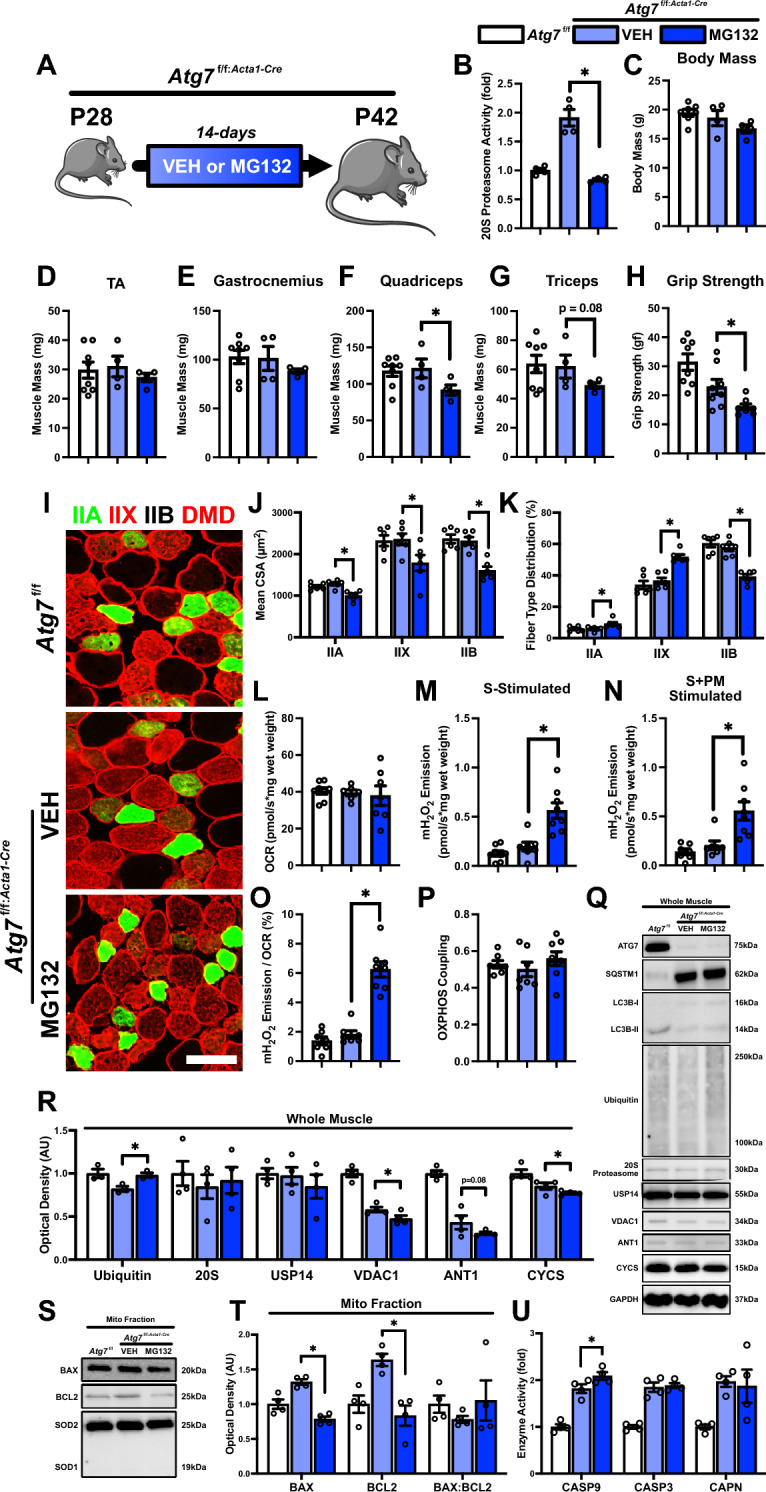
Developmental changes in skeletal muscle of Atg7f/f and Atg7f/f:Acta1−Cre mice treated with either vehicle (VEH) or proteasome inhibitor MG132. A Representative visualization of Atg7f/f:Acta1−Cre mice treated with VEH or MG132 and collected at P42. B Quantification of 20S proteasome activity. Quantification of C Body mass, skeletal muscle mass of D tibialis anterior (TA), E gastrocnemius, F quadriceps, and G triceps, and H peak forelimb grip strength. I Representative immunofluorescent images of TA muscle cross sections from P42 Atg7f/f and Atg7f/f:Acta1−Cre mice. Samples were stained with antibodies specific for individual MYH isoforms: type IIA (green), type IIX (red), type IIB (unstained), and dystrophin (DMD; red). Scale bars indicate 50 μm. J, K Quantification of mean cross-sectional area (CSA) and distribution of type IIA, IIX, and IIB fibers. L Quantification of maximal oxygen consumption rate (i.e., respiration) of permeabilized bundles from TA muscle. Simultaneous quantification of M succinate-stimulated hydrogen peroxide (H2O2) production, and N succinate + pyruvate/malate-stimulated H2O2 production in permeabilized TA muscle bundles. Quantification of O mitochondrial fraction of electron leak and P oxidative phosphorylation (OXPHOS) coupling. Q Representative immunoblots of whole gastrocnemius lysate of Atg7f/f (P42) or Atg7f/f:Acta1−Cre (P42) mice treated with VEH or MG132. R Quantitative analysis of ubiquitin, 20S proteasome, USP14, VDAC1, ANT1, and CYCS. S Representative immunoblots of mitochondrial-enriched fraction from the gastrocnemius of Atg7f/f (P42) or Atg7f/f:Acta1−Cre (P42) mice treated with VEH or MG132. T Quantitative analysis of mitochondrial localized BAX, BCL2, and BAX:BCL2 ratio. U Quantification of CASP9, CASP3, and CAPN activity. * p < 0.05 compared to VEH group. N = 4–8 mice per group. Atg7f/f group data shown for visualization purposes only