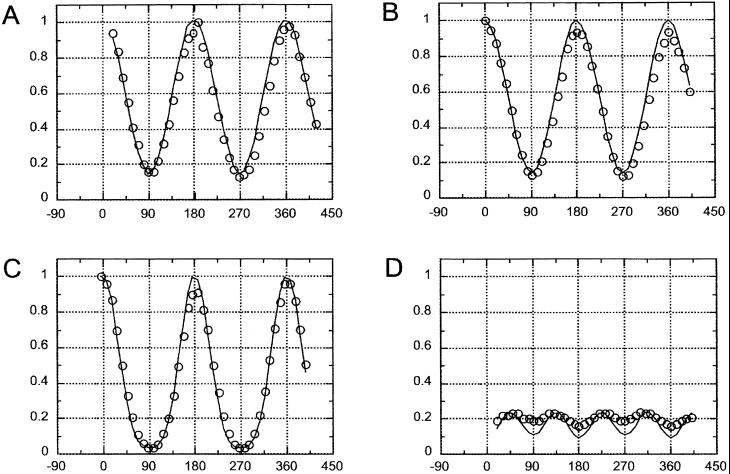
Figure 2.
Normalized fluorescence intensities of crystal versus orientation angle of microscope stage. (A) Open circles: intensity measurements with polarizer present, analyzer absent. Polarizer transmission axis is at 0°. Solid line: plot of I/I0 = 14.05 × cos2φ + 2.65 (from Eq. 1). (B) Open circles: intensity measurements with analyzer present but no polarizer. Analyzer transmission axis is at 0°. Solid line: Plot of I/I0 = 14.55 × cos2φ + 2.40 (from Eq. 2). (C) Open circles: Intensity measurements with both polarizer and analyzer present with their axes parallel to each other and oriented at 0°. Solid line: plot of I/I0 = 22.5 × cos4φ + 2.8 × cos2φ + 1 (from Eq. 3). (D) Open circles: intensity measurements with both polarizer and analyzer present with their axes crossed. Solid line: plot of I/I0 = −11.25 × cos4φ + 11.0 × cos2φ + 2.15 (from Eq. 4). The data points in each graph are for an individual crystal with the microscope stage turned every 10°. The points are shown in measured sequence from left to right, with their maxima normalized to 1.0. Except in B and D, the graphs were derived from separate crystals. The intensities in B and D were both normalized by using the peak value in B.

