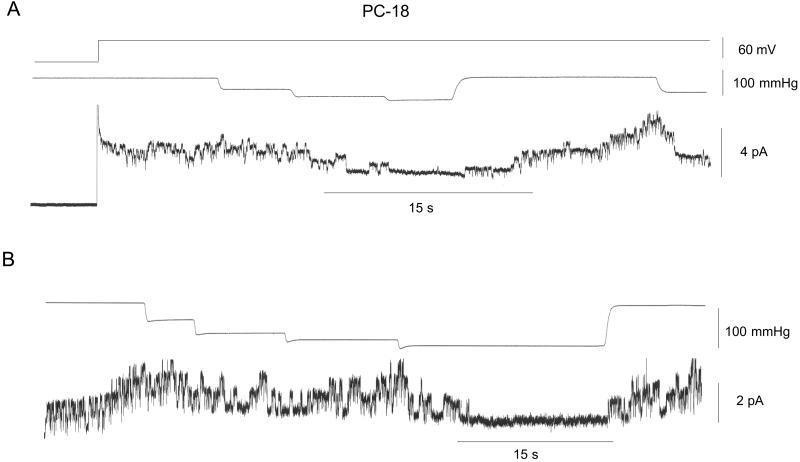
Figure 2.
SI of gA channels in patches isolated from PC-18 liposomes. (A) The top trace indicates the patch potential that was stepped to 60 mV after seal formation. The middle trace shows the staircase increased in pressure (with steps to 45, 75, and 95 mmHg) that caused a deactivation of channels that was maintained for the duration of the 95-mmHg step. On removal of the suction, activity showed full recovery and reapplication of suction near the end of the current trace again closed the channels. (B) Similar protocol to A.

