Figure 3.
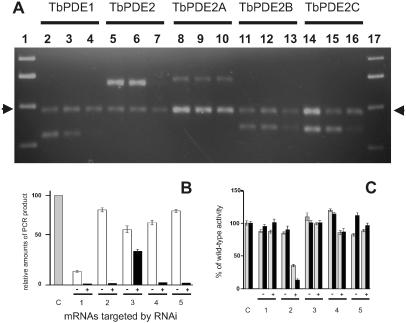
Effect of RNAi on mRNA concentrations and PDE activity in procyclic trypanosomes. (A) Analysis of PCR products 120 h after induction. Lanes 1 and 17, Molecular weight markers; lanes 2–4, RNAi against TbPDE1, source of RNA; lane 2, wild-type cells; lane 3, cells carrying the RNAi construct, but not induced; lane 4, cells carrying the RNAi construct, induced for 120 h with 1 μg/ml tetracycline; lanes 5–7, pan-PDE2 RNAi directed against the entire TbPDE2 family, same arrangement; lanes 8–10, RNAi against TbPDE2A; lanes 11–13, RNAi against TbPDE2B; lanes 14–16, RNAi against TbPDE2C. Arrows indicate the calmodulin-specific PCR product used as an internal control. The primer pairs used for each set are detailed in Materials and Methods and are specific for the mRNA targeted by the respective RNAi constructs. (B) Quantification of RT-PCR products. Means and SEMs from three data sets similar to those shown in A. Sources of RNA: gray bar, control cells; white bars, cells carrying the respective RNAi constructs, no induction; black bars, cells carrying the respective RNAi constructs and induced for 48 h with 1 μg/ml tetracycline. C, Control cells. RNAi constructs directed against: 1, TbPDE1; 2, TbPDE2 family; 3, TbPDE2A; 4, TbPDE2B; and 5, TbPDE2C. Amounts of PCR product in each reaction were normalized with respect to the calmodulin PCR fragment in the same reaction. (C) Reduction of total PDE activity after RNAi. Total PDE activity was determined in whole cell lysates by using 1 μM cAMP as a substrate. Minus and plus signs designate uninduced and induced cultures, respectively. Gray bars, 48 h induction; black bars, 120 h induction. C, control cells. RNAi constructs directed against: 1, TbPDE1; 2, TbPDE2 family; 3, TbPDE2A; 4, TbPDE2B; 5, TbPDE2C.

