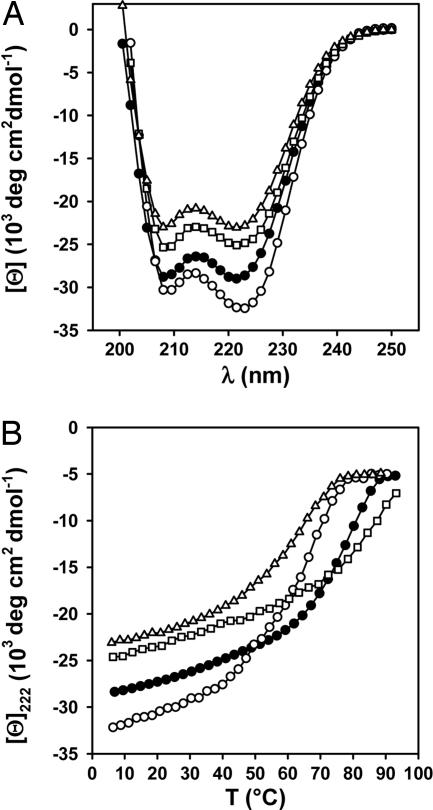
Fig. 3.
CD analysis of WT ccCor1 and variants. Far-UV CD spectra recorded at 5°C (A) and thermal unfolding profiles recorded by CD at 222 nm (B) of ccCor1 (•), ccCor1-R450A (○), ccCor1-R450Nle (□), and ccCor1-R450K (▵). The experiments were carried out at 35 μM peptide concentration (monomer) in PBS.

