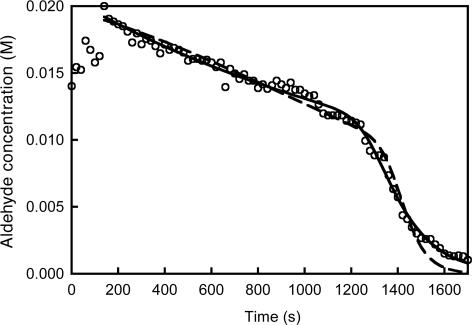
Fig. 4.
Aldehyde consumption vs. time in an NMR-monitored Soai reaction (○) (ref. 16) fitted by model 2 (continuous line) and by model 3 (broken line). Initial concentrations (M): [A] = 1.92 × 10⁻² and [Z] = 0.04; rate parameters model 2 {model 3}: k0′ = 5.2 × 10⁻³ {3.7 × 10⁻³} M–1·s–1; k1′ = 69 M–2·s–1 {k6 = 154 M–2·s–1, k7 = 2.1 × 10⁻⁴ M–2·s–1}; k2 = 4.5 × 10⁵ {9.2 × 10⁵} M–1·s–1; k3 = 5.2 × 10⁻² {6.4 × 10⁻⁴} s–1; k4 = 4.8 × 10³ {1.1 × 10⁴} M–1·s–1; and k5 = 21 {6.4 × 10⁻⁴} s–1. The first seven data points have not been taken into account.

