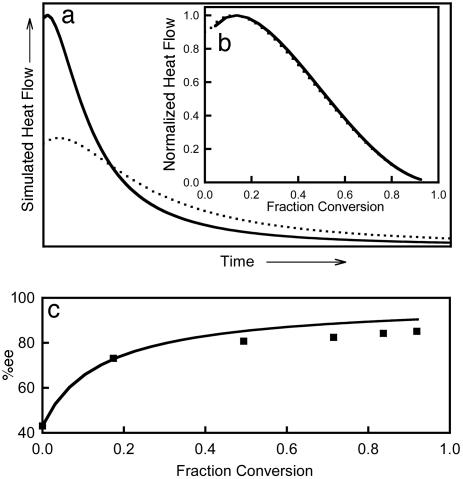
Fig. 5.
Effect of catalyst enantiomeric purity. (a) Simulated reaction heat flows vs. time by model 2. Continuous line, enantiopure catalyst; dotted line, racemic catalyst. The relation between the heat flow maxima is around 50%. (b) Normalized heat flows vs. fraction conversion. The enantiopure and racemic catalyst curves are nearly superimposed. (c) Percent ee vs. fraction conversion for the case ee(cat) = 43%; ▪, experimental results from ref. 20. For all simulations, the rate constants were the same as in Fig. 4 except k3 = 1.0 × 10² s–1; [A]0 = [Z]0 = 0.2 M; and [R}0 + [S]0 = 2.0 × 10⁻² M.

