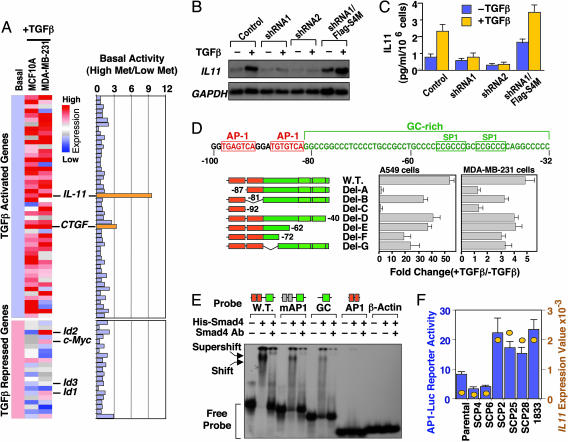
Fig. 3.
Smad4 and AP1-dependent transcriptional activation of IL-11 by TGF-β. (A) Basal expression levels of 50 TGF-β-activated genes and 21 TGF-β-repressed genes in MCF-10A and MDA-MB-231 cells were normalized to the same level. (Left) Responses of these genes to TGF-β in each cell line are represented by different shades of red (degrees of activation) or blue (degrees of repression) in the dendrogram. (Right) The ratio of basal expression levels of these 71 genes in highly metastatic versus weakly metastatic MDA-MB-231 cells. Genes of interest are highlighted. (B) SCP25 and its derivatives (see Fig. 5B) were incubated in the absence or presence of TGF-β for 2 h. Total RNA was subjected to Northern blot analysis with the indicated probes. (C) SCP25 and its derivatives were treated with or without TGF-β for 24 h. IL-11 production in the media was determined with an ELISA assay. Data are the average of triplicate determinations ± SD. (D)(Upper) Nucleotide sequence of the minimal TGF-β-responsive region of the IL-11 promoter. Nucleotide sequence positions are indicated relative to the transcription start site. Two AP1 sites (red boxes) and a GC-rich sequence (green) containing two SP1 sites (green boxes) are indicated. (Lower)(Center and Right) A549 (Center) and MDA-MB-231 (Right) cells were transfected with the indicated IL-11 reporter constructs, treated with or without TGF-β for 16–20 h before lysis, and analyzed for luciferase activlty. Data are the average of triplicate determinations ± SD. (Left) The schematic representation of each promoter construct. (E) [γ32-P]ATP end-labeled probes matching to the wild-type IL-11 proximal promoter region, this region with mutant AP1 sites (mAP1), or the indicated fragments of this region were subjected to electrophoretic mobility shift analysis with recombinant full-length His-Smad4 protein. Antibody against Smad4 was added as indicated to create supershifts. The β-actin promoter was used as a negative control. Schematic representations of the probes are shown above the gel. (F) Various MDA-MB-231 sublines were transfected with 1 μg of 4xAP1-Luc reporter plasmid and analyzed for luciferase activity 2 days after transfection. Data are the average of triplicate determinations ± SD. The absolute values of IL 11 mRNA level as detected by an Affymetrix U133A GeneChip were plotted in the same graph (yellow circles). The scales for the luciferase activity and for IL-11GeneChip expression values are shown to the left and right of the graph, respectively.

