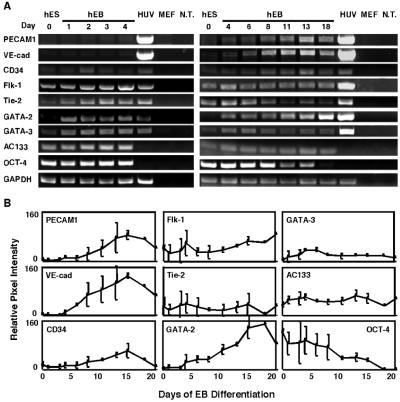
Figure 1.
Endothelial gene expression in hES-derived EBs by RT-PCR analysis. (A) RNA was isolated from undifferentiated hES cells and from hEBs at different time points (days) during differentiation and subjected to RT-PCR analysis. The negative controls, no template (N.T.) and MEF, and the HUVEC positive control (HUV) are shown to the right. (B) Quantitative analysis of gene expression. Relative pixel intensity corresponds to gene expression level; for each time point, mean pixel intensities of each band were measured and normalized to mean pixel intensities of GAPDH band. The results shown are mean values ±SD of three different experiments.

