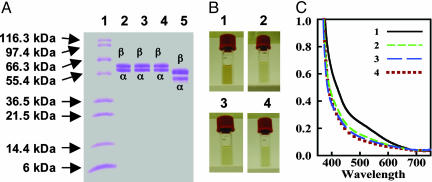
Fig. 1.
SDS/PAGE, color, and visible region spectra of ΔnifB Av1, ΔnifH Av1, ΔnifH Av1′, and ΔnifB Av1V.(A) Coomassie-stained 10–20% gradient SDS/PAGE. Lane 1, 10 μg of protein standard; lane 2, 15 μg of purified ΔnifB Av1; lane 3, 15 μg of purified ΔnifH Av1; lane 4, 15 μg of purified ΔnifH Av1′; and lane 5, 15 μg of purified ΔnifB Av1V.(B) Anaerobic cuvettes filled with dithionite-reduced ΔnifB Av1 (part 1), ΔnifH Av1 (part 2), ΔnifH Av1′ (part 3), and ΔnifB Av1V (part 4). The protein concentrations of all samples were 5 mg/ml. (C) Visible region spectra of samples shown in B. Spectra of dithionite-reduced ΔnifB Av1 (line 1), ΔnifH Av1 (line 2), ΔnifH Av1′ (line 3), and ΔnifB Av1V (line 4) are shown between 350 and 750 nm. The samples were prepared as described in Materials and Methods.

