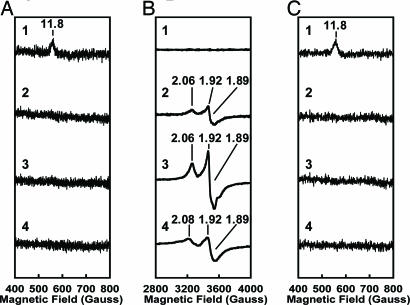
Fig. 2.
EPR spectroscopy of ΔnifB Av1, ΔnifH Av1, ΔnifH Av1′, and ΔnifB Av1V.(A) Parallel-mode EPR spectra of IDS-oxidized ΔnifB Av1 (line 1), ΔnifH Av1 (line 2), ΔnifH Av1′ (line 3), and ΔnifB Av1V (line 4). (B) Perpendicular-mode EPR spectra of dithionite-reduced ΔnifB Av1 (line 1), ΔnifH Av1 (line 2), ΔnifH Av1′ (line 3), and ΔnifB Av1V (line 4). (C) Parallel-mode EPR spectra of IDS-oxidized, FeMoco-reconstituted ΔnifB Av1 (line 1), ΔnifH Av1 (line 2), ΔnifH Av1′ (line 3), and ΔnifB Av1V (line 4). The protein concentrations of parallel-mode EPR samples were 5, 50, 50, and 50 mg/ml for ΔnifB Av1, ΔnifH Av1, ΔnifH Av1′, and ΔnifB Av1V, respectively. The protein concentrations of all perpendicular-mode EPR samples were 10 mg/ml. All spectra were measured as described in Materials and Methods. The g values are indicated.

