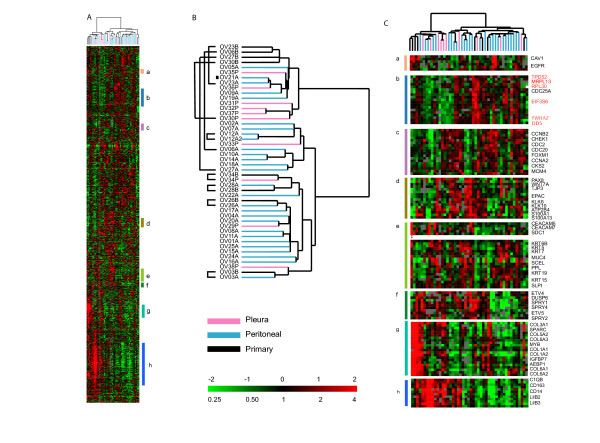
Figure 1.
Overview of Primary Tumors and Effusions. (A) Global gene expression patterns of 46 ovarian cancers: 8 primary tumors, 10 pleural effusions and 28 peritoneal effusions, were sorted based on similarity of expression following hierarchical clustering. 2863 genes were selected from the total data set based on variance greater than 2.5 fold in at least 3 arrays. (B) The dendrogram is color-coded pink (pleural effusions), blue (peritoneal effusions) and black (primary tumors) to indicate site of origin of the cancers. Indicates the clear cell sample. (C) Magnified view of specific gene clusters selected from the entire set of 2863 genes: (a) Caveolin 1 and EGFR, (b) Chromosome 8 (Genes on Chromosome 8 are denoted in red), (c) Cell Cycle Associated Genes, (d) Kallikreins 6, 10, (e) Epithelial, (f) Sprouty cluster, (g) Stromal cluster, (h) immune response cluster. The scale is indicated in the bottom right-hand corner and spans 0.25 to 4 fold over mean (-2 to +2 in log2 space). Missing data are denoted in gray.

