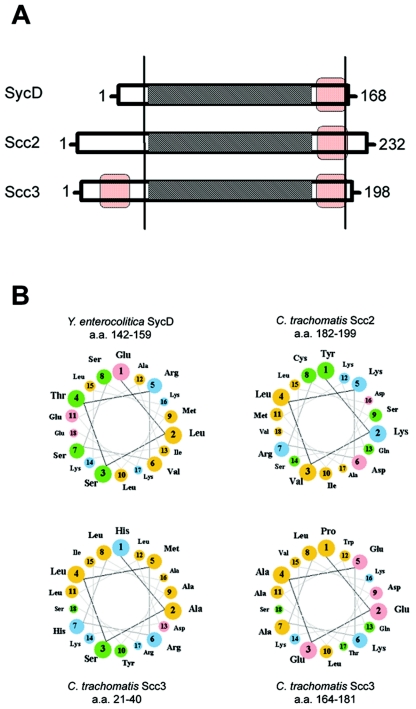
FIG. 1.
Comparison of C. trachomatis Scc2 and Scc3 with Yersinia SycD. (A) Schematic representations of proteins, indicating numbers of total residues. Vertical bars bracket domains in which sequence similarities are found. Respective TPR are shown as shaded areas, and amphipathic helices are represented by red boxes. (B) Amphipathic characters of predicted α helices are shown in helical wheel projections (http://cti.itc.virginia.edu/∼cmg/Demo/wheel/wheelApp.html), where nonpolar residues are shown in orange, polar, uncharged residues in green, acidic residues in pink, and basic residues in blue. Residue numbers of corresponding domains are provided for respective proteins. a.a., amino acids.

